


Power Bi For Fp&a And Financial Reporting
Category: Tutorials
- views: 184
- date: 8 June 2026
- posted by: 0nelove
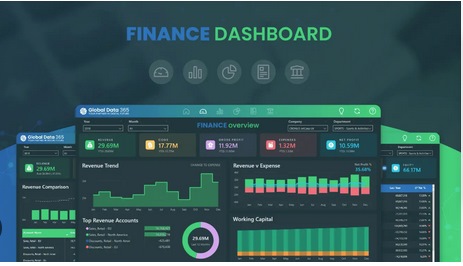
Power Bi For Fp&a And Financial Reporting
Published 6/2026
Created by Rushan Rafiq
MP4 | Video: h264, 1920x1080 | Audio: AAC, 44.1 KHz, 2 Ch
Level: Intermediate | Genre: eLearning | Language: English | Duration: 38 Lectures ( 2h 15m ) | Size: 1.5 GB
Build professional P&L dashboards, variance analysis reports, financial models and executive reports in Power BI
What you'll learn
⚡ Build a professional P&L reporting dashboard in Power BI from scratch using real-world financial reporting techniques
⚡ Create interactive Actual vs Budget, Forecast, and Last Year variance analysis reports used by FP&A and finance teams
⚡ Design drill-down P&L hierarchies that allow users to move from summary results to detailed financial drivers
⚡ Prepare, transform, and model financial data using Power Query and Power BI data modeling best practices
⚡ Develop DAX measures for financial reporting, scenario analysis, calculated P&L lines, and dynamic currency reporting
⚡ Apply finance-focused dashboard design principles to create clear, executive-friendly management reports
Requirements
❗ Basic familiarity with Power BI is recommended (loading data, creating simple visuals, and navigating the interface).
❗ Basic understanding of PNL such as Revenue, Costs, Gross Profit, and Net Profit will be helpful but not mandatory
❗ A Windows PC with Power BI Desktop installed (free download from Microsoft).
Description
Financial reporting is one of the most common use cases for Power BI.
In this course, you'll learn how to build a professional financial reporting dashboard from scratch using Power BI and real-world FP&A (Financial Planning and Analysis) reporting concepts.
Whether you're an FP&A professional, finance analyst, controller, accountant, or Power BI developer supporting finance teams, this course will teach you how to transform raw financial data into meaningful management reports that support better business decisions.
Unlike many Power BI courses that focus primarily on visuals and technical features, this course combines Power BI development with the financial reporting concepts used by finance teams every day.
Throughout the course, we'll build a complete P&L reporting dashboard that allows users to
✨ Analyze Actual, Budget, Forecast, and Last Year performance
✨ Perform variance analysis across multiple scenarios
✨ Drill from high-level P&L summaries into detailed reporting lines
✨ Switch between reporting currencies dynamically
✨ Explore financial results using interactive slicers and filters
✨ Identify favorable and unfavorable variances quickly
✨ Create executive-friendly management reports
Along the way, you'll learn how to
✨ Connect and consolidate multiple financial files using Power Query
✨ Transform and prepare financial data for reporting
✨ Structure financial data models using best practices
✨ Build P&L hierarchies and drill-down reporting structures
✨ Create dynamic DAX measures for financial reporting
✨ Implement scenario-based reporting logic
✨ Design dashboards specifically for finance audiences
✨ Apply visualization principles used in professional management reporting
What You'll Build
By the end of the course, you'll have built a complete financial reporting dashboard featuring
✨ Interactive P&L reporting
✨ Budget vs Actual analysis
✨ Forecast vs Actual analysis
✨ Last Year comparisons
✨ Variance reporting
✨ Drill-down hierarchy navigation
✨ Dynamic currency selection
✨ Professional dashboard formatting
More importantly, you'll understand not only how to build the dashboard, but also why finance teams structure reports the way they do.
Who this course is for
⭐ FP&A professionals who want to build professional financial reporting dashboards in Power BI.
⭐ Finance managers, commercial finance analysts, and business controllers looking to automate financial reporting and variance analysis.
⭐ Power BI users who want to learn how financial reports differ from traditional business dashboards.
⭐ Accountants and finance professionals looking to modernize their reporting skills and move beyond Excel-based reporting.
⭐ Finance students and aspiring FP&A professionals who want practical experience building real-world financial reports.
Homepage
https://anonymz.com/?
https://www.udemy.com/course/pbifinance
https://rapidgator.net/file/1aeb8b0ed88f17ef6742933964ac54e1/Power_BI_for_FP&A_and_Financial_Reporting.part2.rar.html
https://rapidgator.net/file/33da103721ca57488dd7ec57e2aad406/Power_BI_for_FP&A_and_Financial_Reporting.part1.rar.html
https://nitroflare.com/view/DBE0523A785B58E/Power_BI_for_FP%26amp%3BA_and_Financial_Reporting.part2.rar
https://nitroflare.com/view/5518871783384F9/Power_BI_for_FP%26amp%3BA_and_Financial_Reporting.part1.rar
https://rapidgator.net/file/33da103721ca57488dd7ec57e2aad406/Power_BI_for_FP&A_and_Financial_Reporting.part1.rar.html
https://nitroflare.com/view/DBE0523A785B58E/Power_BI_for_FP%26amp%3BA_and_Financial_Reporting.part2.rar
https://nitroflare.com/view/5518871783384F9/Power_BI_for_FP%26amp%3BA_and_Financial_Reporting.part1.rar
We need your support!
Make a donation to help us stay online

Bitcoin (BTC)
bc1q08g9d22cxkawsjlf8etuek2pc9n2a3hs4cdrld

Bitcoin Cash (BCH)
qqvwexzhvgauxq2apgc4j0ewvcak6hh6lsnzmvtkem

Ethereum (ETH)
0xb55513D2c91A6e3c497621644ec99e206CDaf239

Litecoin (LTC)
ltc1qt6g2trfv9tjs4qj68sqc4uf0ukvc9jpnsyt59u

USDT (ERC20)
0xb55513D2c91A6e3c497621644ec99e206CDaf239

USDT (TRC20)
TYdPNrz7v1P9riWBWZ317oBgJueheGjATm
Information |
|||
 |
Users of GUESTS are not allowed to comment this publication. | ||