


PivotTables & Power Pivot | Analyse Data Faster and Smarter
Category: Tutorials
- views: 94
- date: 30 November 2025
- posted by: AD-TEAM
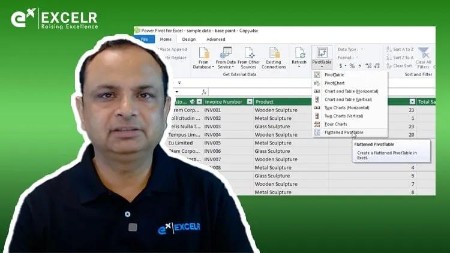
PivotTables & Power Pivot | Analyse Data Faster and Smarter
Published 11/2025
Duration: 1h 23m | .MP4 1280x720 30fps(r) | AAC, 44100Hz, 2ch | 1.18 GB
Genre: eLearning | Language: English
Master Excel's most powerful analysis tools to summarise and explore large datasets.
What you'll learn
- Build PivotTables to summarise and analyse data
- Create PivotCharts for quick visual insights
- Use slicers and timelines for interactive filtering
- Build data models using Power Pivot
- Understand relationships and DAX fundamentals
Requirements
- Basic Excel knowledge
- No prior data modelling experience required
Description
PivotTables transform how you work with data in Excel. Instead of scrolling through thousands of rows or building long chains of formulas, you can summarise information instantly and explore it from multiple angles. They make it possible to analyse sales trends, review performance metrics, compare categories, or audit operational activity with far greater clarity.
A strong outcome with PivotTables always begins with the way data is prepared. You'll learn how to organise your source tables so that every summary, chart, or filter produces reliable results. Once your dataset is ready, you'll create PivotTables step by step—rearranging fields, grouping information, adding custom calculations, and building interactive filters like slicers and timelines. Each feature is applied through practical scenarios so you understand how it fits into real workplace tasks.
As you progress, you'll explore visual reporting through PivotCharts, learning how to convert insights into clear visuals that decision-makers can interpret quickly. You'll also see how to keep dashboards updated with minimal manual work.
Larger or more complex datasets introduce a new challenge, which is where Power Pivot becomes valuable. You'll work with multiple tables, model relationships, and use entry-level DAX formulas to perform calculations that regular PivotTables can't handle. This expands your ability to build scalable, professional-grade analysis systems inside Excel.
With these combined skills, you'll be able to create fast, flexible, and reliable reports that elevate your analytical capabilities across any business function.
Who this course is for:
- Analysts, business professionals, finance teams, operations, HR, and learners preparing for job interviews.
More Info

RapidGator
https://rapidgator.net/file/56b4fa5d1cf8d850d8aa6ca952627bca/pivottables..power.pivot..analyse.data.faster.and.smarter.part1.rar
https://rapidgator.net/file/131cc0bac2285edba3608e2f0ebbebf6/pivottables..power.pivot..analyse.data.faster.and.smarter.part2.rar
NitroFlare
https://nitroflare.com/view/96D08E60AB386D6/pivottables..power.pivot..analyse.data.faster.and.smarter.part1.rar
https://nitroflare.com/view/DB4BBA312153351/pivottables..power.pivot..analyse.data.faster.and.smarter.part2.rar
DDownload
https://ddownload.com/vmkh3qbb16hr/pivottables..power.pivot..analyse.data.faster.and.smarter.part1.rar
https://ddownload.com/v8xj0ag9xfnq/pivottables..power.pivot..analyse.data.faster.and.smarter.part2.rar
We need your support!
Make a donation to help us stay online

Bitcoin (BTC)
bc1q08g9d22cxkawsjlf8etuek2pc9n2a3hs4cdrld

Bitcoin Cash (BCH)
qqvwexzhvgauxq2apgc4j0ewvcak6hh6lsnzmvtkem

Ethereum (ETH)
0xb55513D2c91A6e3c497621644ec99e206CDaf239

Litecoin (LTC)
ltc1qt6g2trfv9tjs4qj68sqc4uf0ukvc9jpnsyt59u

USDT (ERC20)
0xb55513D2c91A6e3c497621644ec99e206CDaf239

USDT (TRC20)
TYdPNrz7v1P9riWBWZ317oBgJueheGjATm
Information |
|||
 |
Users of GUESTS are not allowed to comment this publication. | ||