


Excel Dashboard Design For Business Insights
Category: Tutorials
- views: 188
- date: 5 November 2025
- posted by: mitsumi
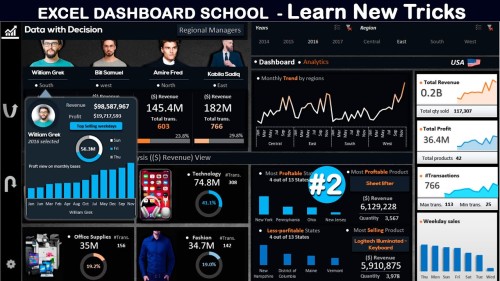
Excel Dashboard Design For Business Insights
Published 10/2025
MP4 | Video: h264, 1920x1080 | Audio: AAC, 44.1 KHz
Language: Arabic | Size: 1.86 GB | Duration: 2h 15m
Learn to build interactive dashboards using PivotTables, KPIs, and slicers — ideal for HR, marketing, and finance roles.
What you'll learn
- Understand Dashboard Fundamentals Learn the purpose, structure, and key principles of effective dashboard design.
- Master Excel Visualization Tools Use charts, graphs, slicers, and conditional formatting to create dynamic visuals.
- Design Interactive Dashboards Build dashboards with drop-downs, buttons, and filters for user-friendly navigation
- Integrate Pivot Tables and Pivot Charts Summarize and analyze large datasets with interactive pivot-based components.
- Use Named Ranges and Dynamic Arrays Create scalable dashboards that automatically update with new data.
- Automate with Excel Power Tools Explore Power Query and Power Pivot for data transformation and modeling.
- Ensure Dashboard Performance and Usability Optimize layout, speed, and clarity for real-world business use.
- Build HR, Finance, and Sales Dashboards Apply skills to practical, department-specific dashboard examples. - Prepare Dashboards for Presentation Learn how to
- Prepare Dashboards for Presentation Learn how to export, share, and present dashboards professionally.
Requirements
Basic knowledge of Excel (e.g., using formulas, formatting cells, navigating worksheets)
No prior experience with dashboards is required — the course starts from scratch
Microsoft Excel 2016 or later (Excel 365 is recommended for full feature access)
Description
This course is taught entirely in Arabic and is designed to help professionals turn raw Excel data into interactive dashboards that support smarter decision-making. Whether you're working in HR, marketing, finance, or sales, dashboards are essential tools for visualizing performance, tracking KPIs, and presenting insights clearly and effectively across teams and departments.Through practical, hands-on training, you'll learn how to clean and prepare real-world datasets, build PivotTables and dynamic charts, design meaningful KPIs, and add interactive elements like slicers and timelines. You'll also learn how to format dashboards for print and presentation, making them suitable for meetings, reports, and training sessions.The course includes realistic scenarios and exercises that reflect actual business challenges. You'll work with authentic datasets and build dashboards that can be used in:Human Resources: tracking employee performance, training results, and hiring metricsMarketing: analyzing campaign results, customer behavior, and ROIFinance: monitoring revenue, expenses, and profitabilitySales: comparing branch performance, customer segmentation, and monthly targetsTraining & Education: visualizing learner progress, feedback analysis, and engagement metricsBy the end of the course, you'll be able to design professional dashboards using Excel tools only—no coding required or advanced software needed. These dashboards will enhance communication, improve reporting, and support data-driven decisions.
HR, Finance, and Business Professionals Seeking to create insightful dashboards for reporting, analysis, and decision-making.,Data Analysts and Excel Enthusiasts Looking to upgrade their visualization skills and build interactive dashboards.,University Students and Fresh Graduates Wanting to boost their CVs with practical Excel dashboard skills.,Trainers and Lecturers in Business or IT Fields Interested in teaching dashboard design with real-world applications.,Entrepreneurs and Small Business Owners Needing to track KPIs, sales, or HR metrics in a simple, visual format.,Anyone with Basic Excel Knowledge Ready to move from formulas to professional-level dashboard creation.
DOWNLOAD
https://rapidgator.net/file/18e7c921aab47bcd57e0fe757a73e8de/Excel_Dashboard_Design_for_Business_Insights.part2.rar.html
https://rapidgator.net/file/0cad3ef907917688a650bfa9362465fe/Excel_Dashboard_Design_for_Business_Insights.part1.rar.html
https://ddownload.com/q4hmjxddjkd3/Excel_Dashboard_Design_for_Business_Insights.part2.rar
https://ddownload.com/kl5g2i5dcc3c/Excel_Dashboard_Design_for_Business_Insights.part1.rar
We need your support!
Make a donation to help us stay online

Bitcoin (BTC)
bc1q08g9d22cxkawsjlf8etuek2pc9n2a3hs4cdrld

Bitcoin Cash (BCH)
qqvwexzhvgauxq2apgc4j0ewvcak6hh6lsnzmvtkem

Ethereum (ETH)
0xb55513D2c91A6e3c497621644ec99e206CDaf239

Litecoin (LTC)
ltc1qt6g2trfv9tjs4qj68sqc4uf0ukvc9jpnsyt59u

USDT (ERC20)
0xb55513D2c91A6e3c497621644ec99e206CDaf239

USDT (TRC20)
TYdPNrz7v1P9riWBWZ317oBgJueheGjATm
Information |
|||
 |
Users of GUESTS are not allowed to comment this publication. | ||