


Excel Data Visualization And Dashboard Design Masterclass
Category: Tutorials
- views: 123
- date: 29 September 2025
- posted by: 0nelove
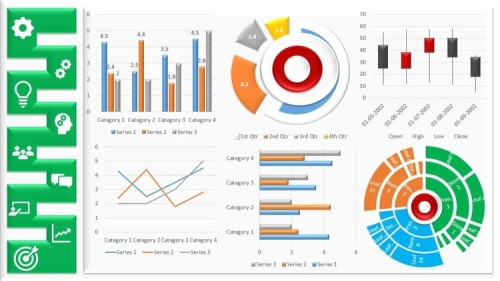
Excel Data Visualization And Dashboard Design Masterclass
Published 9/2025
Created by Brighter Futures Hub
MP4 | Video: h264, 1280x720 | Audio: AAC, 44.1 KHz, 2 Ch
Level: All | Genre: eLearning | Language: English | Duration: 24 Lectures ( 3h 0m ) | Size: 1.36 GB
Learn To Transform Raw Data Into Stunning, Interactive Dashboards Using Excel Charts, Pivot Tables, Formulas, and Design
What you'll learn
Importance of Data Visualization in Decision Making
Overview of Excel Visualization Tools
Data Types, Structure, and Best Practices for Clean Visuals
Structuring and Cleaning Data Tables
Using Excel Tables for Dynamic Ranges
asic Functions for Data Prep
Choosing the Right Chart: When and Why
Bar & Column Charts
Line & Area Charts
Pie & Donut Charts
Conditional Formatting (Data Bars, Icon Sets, Heat Maps)
Custom Chart Designs (Gauge Charts, Bullet Charts Using Creative Techniques)
Building PivotTables for Data Summarization
Creating PivotCharts From PivotTables
Dashboard Wireframing and Layout Techniques
Color Schemes, Fonts, Spacing, and Chart arrangement
Best Practices for Performance Optimization and more
Requirements
No prior excel experience required
Description
In today's data driven world, the ability to visualize data clearly and design professional dashboards is one of the most valuable skills you can have. Microsoft Excel is not just a spreadsheet tool—it's a powerful platform for creating interactive dashboards, business reports, and compelling visualizations that drive smarter decisions.This masterclass is designed to take you from the foundations of Excel visualization all the way to building dynamic, interactive dashboards used in business, finance, and analytics. With a practical, step by step approach, you'll learn how to transform raw data into meaningful insights and create dashboards that impress stakeholders.What You Will Learn:Importance of Data Visualization in Decision Making (Urgent text holeo voice de nite hobe)Overview of Excel Visualization ToolsData Types, Structure, and Best Practices for Clean VisualsPrinciples of Effective Dashboard Design (Clarity, Simplicity, Interactivity)Structuring and Cleaning Data TablesUsing Excel Tables for Dynamic RangesIntroduction to Named Ranges and Dynamic formulasBasic Functions for Data Prep: IF, VLOOKUP/XLOOKUP, TEXT, CONCAT, etc.Choosing the Right Chart: When and WhyCreating and Customizing:Bar & Column ChartsLine & Area ChartsPie & Donut ChartsCombo ChartsScatter and Bubble ChartsWaterfall ChartsFormatting Tips for Clean VisualsConditional Formatting (Data Bars, Icon Sets, Heat Maps)In-Cell Charts with SparklinesUsing Formulas to Power Visual CuesCustom Chart Designs (Gauge Charts, Bullet Charts Using Creative Techniques)Building PivotTables for Data SummarizationCreating PivotCharts From PivotTablesUsing Slicers and Timelines for Interactive FilteringGrouping and Custom Calculations in PivotTablesDashboard Wireframing and Layout TechniquesDesigning for the End User: Clarity and UsabilityColor Schemes, Fonts, Spacing, and Chart arrangementBest Practices for Performance OptimizationUsing Form Controls (Drop-Down Lists, Scrollbars, Buttons)Linking Controls with Charts Using Named Ranges and FormulasCreating Dynamic KPIs (Key Performance Indicators)Embedding Interactive Elements: Mini Charts, Summary Cards, and TogglesWhy This Course?Build dashboards step by step with real examplesGain techniques used by analysts, managers, and consultantsFrom chart design basics to advanced interactive dashboardsLearn how to create dashboards that are not only attractive but also highly functionalBy the end of this course, you will be able to design and build interactive Excel dashboards that make data easy to understand, visually engaging, and ready for professional presentations.
Who this course is for
Anyone looking to communicate insights more effectively through Excel
Students and job seekers preparing for data driven roles
Excel users who want to upgrade from basic charts to professional dashboards
Business analysts, managers, and finance professionals who work with data
https://way4share.com/975u/Excel_Data_Visualization_and_Dashboard_Design_Masterclass.part2.rar
https://way4share.com/975w/Excel_Data_Visualization_and_Dashboard_Design_Masterclass.part1.rar
https://rapidgator.net/file/5d777c7c9dcdad0ad34e1ad3f24f1596/Excel_Data_Visualization_and_Dashboard_Design_Masterclass.part2.rar.html
https://rapidgator.net/file/c2c357d2fd6389bfb20dd363d5e3fb32/Excel_Data_Visualization_and_Dashboard_Design_Masterclass.part1.rar.html
We need your support!
Make a donation to help us stay online

Bitcoin (BTC)
bc1q08g9d22cxkawsjlf8etuek2pc9n2a3hs4cdrld

Bitcoin Cash (BCH)
qqvwexzhvgauxq2apgc4j0ewvcak6hh6lsnzmvtkem

Ethereum (ETH)
0xb55513D2c91A6e3c497621644ec99e206CDaf239

Litecoin (LTC)
ltc1qt6g2trfv9tjs4qj68sqc4uf0ukvc9jpnsyt59u

USDT (ERC20)
0xb55513D2c91A6e3c497621644ec99e206CDaf239

USDT (TRC20)
TYdPNrz7v1P9riWBWZ317oBgJueheGjATm
Information |
|||
 |
Users of GUESTS are not allowed to comment this publication. | ||