


Grafana Tutorial
Category: Tutorials
- views: 102
- date: 19 September 2025
- posted by: AD-TEAM

Grafana Tutorial
.MP4 | Video: 1280x720, 30 fps(r) | Audio: AAC, 44100 Hz, 2ch | 1.46 GB
Duration: 2 hours | Genre: eLearning Video | Language: English
Ready yourself! Graduate with real skills in Grafana!
What you'll learn
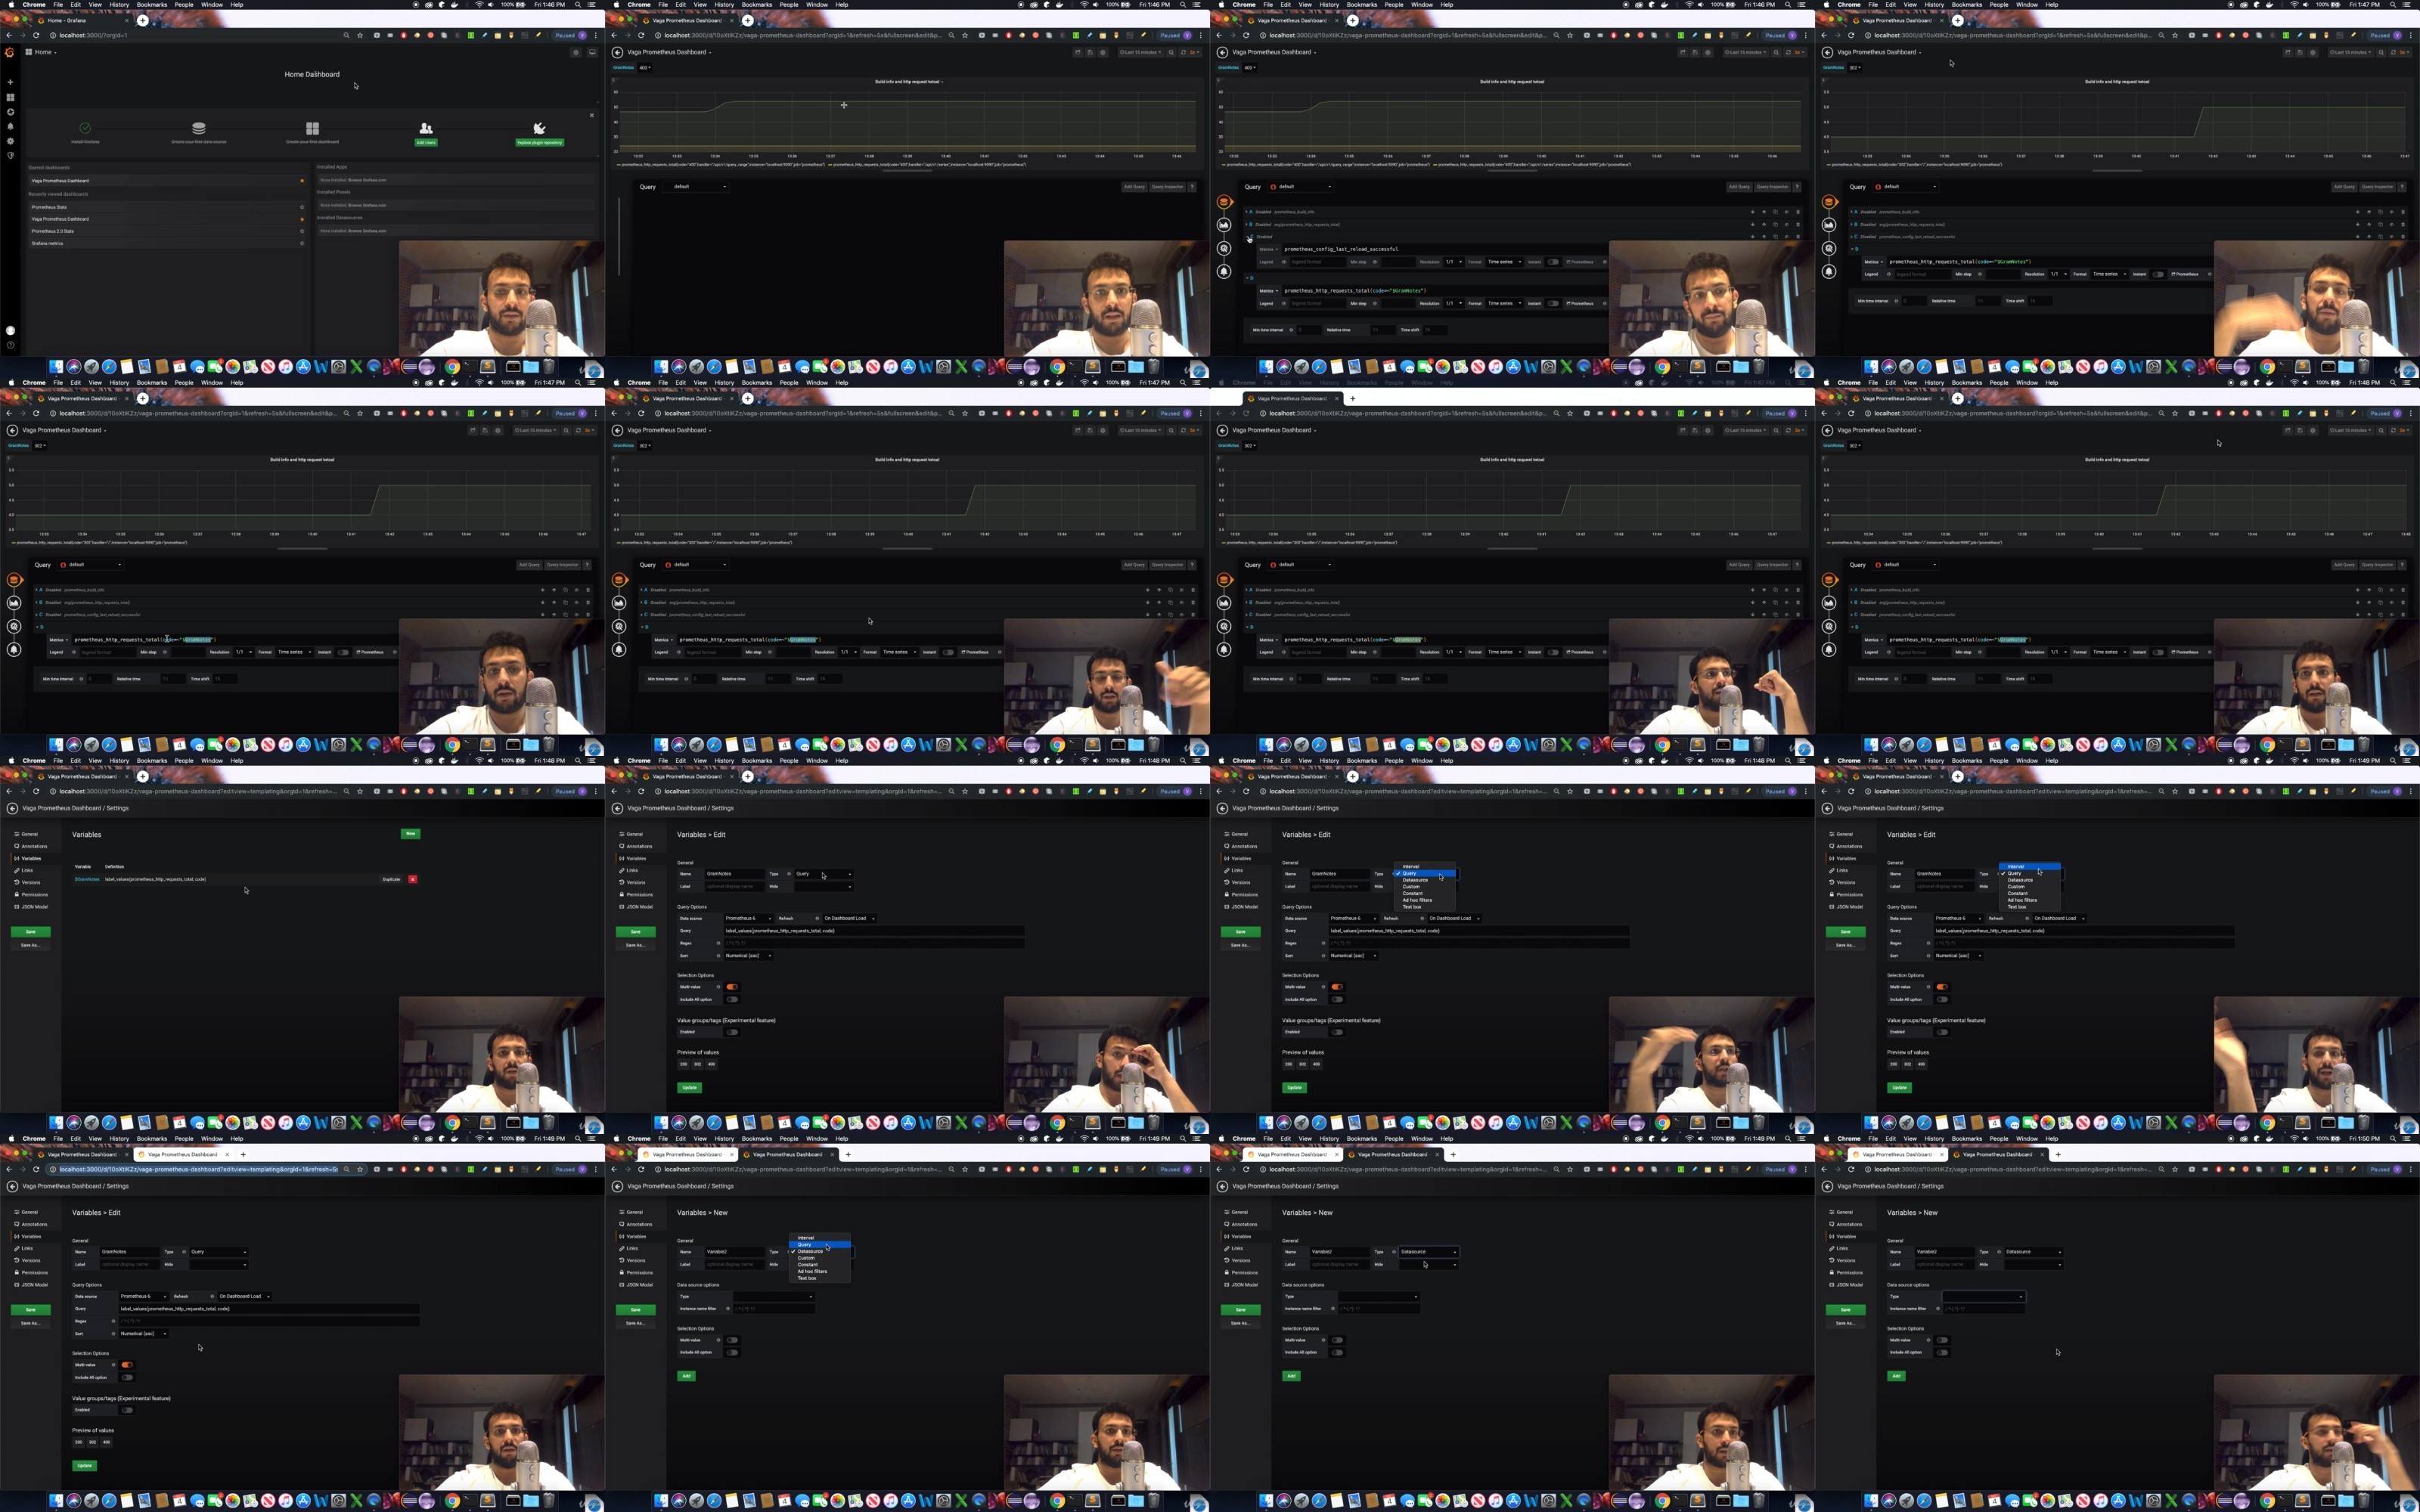
Setup and Run Grafana on Mac and Windows
Concepts and Definitions to give you the tools you need to understand the practical lectures with Grafana
Setup Prometheus as the primary data source which we will be using during the course
Learn how to use variables in Grafana
Build basic dashboards and use different panels
Use Annotations and MarkUp your graphs
Use KeyBoard Shortcuts to get your work done that much faster
Organize your dashboards with folders and playlists
Search and Share your dashboards
Setup alerting with Emails and Slack
Requirements
An Internet connection
A working Computer with either Windows/MacOS or Linux
A desire to learn and Crush It!
Elementary knowledge of Unix/Linux can help you, but not needed
Description
Always have a hard time visualizing data? Is debugging support issues a pain? Well time to switch to Grafana! Grafana provides you with powerful editable visual dashboards representing your data. You write the queries and alerts, so when things get out of hands, you get notified with a visual dashboard of what went wrong.
Whether you are a Software Architect looking for a way to switch over you're conventional logging mechanism to the next generation of tools or a developer looking for a one stop shop to manage your entire data/monitoring storage and computation framework, Grafana is the solution for you.
You will get a quick grasp on Grafana. It's a great way of monitoring your infrastructure, linux or windows. You can even upgrade to the Cloud if you feel the need. Connect to a variety of data sources like Prometheus, Graphite, InfluxDB, MYSQL, MS-SQL etc.
Everything is well documented and separated, so you can find what you need. Assignments and Quizzes will make sure you stay on track and test your knowledge. The course will have a combination of theory and practical examples.
Introduction
Setup and Install for Grafana. Get Familiar with both, Windows and Mac. Then go on to Concepts where you learn the terms we will be using going forward.
Data Sources
Setup Prometheus as the Primary Data Source which we will be using. On the Windows and Mac machine. Then connect it to Grafana.
DashBoards and Variables
Start by creating a basic dashboard and building a query. Then learn about variables and all the features that come along. Learn about Interpolation.
DashBoard Efficiency
Time to heat things up. We don't want to you to be average, here you exploit Grafana for all its features. Start of by using Annotations to mark your graph, followed up by KeyBoard shortcuts to make you faster. Use Folders and PlayLists to organize your dashboards. Search and Share properly.
Alerts
Did something go wrong? Is the load on the server too high? Time to find out. Locate and Edit your grafana config file to be able to send mails. Create a notification channel as well as an alert. Do the same to setup a Slack notification channel. Create a Slack web-hook and sync it with Grafana.
Who this course is for:
Students trying to get a quick grasp of Grafana
Developers looking to monitor and Visualize their apps/machines/servers with Grafana
Developers and Software Architects who have used another tool to monitor their apps and are now looking to move over to Grafana
Devs looking to run analysis on the the data from their Apps
Those who like their data good looking :)
For More Courses Visit & Bookmark Your Preferred Language Blog
From Here: - - - - - - -
Download Links
RapidGator
https://rapidgator.net/file/d0bf0999ae6bbd1b693fe0c0d9e96bef/yxusj.Udemy.-.Grafana.Tutorial.part1.rar
https://rapidgator.net/file/c8b5853be94a1beb75b3f62aaafa86ad/yxusj.Udemy.-.Grafana.Tutorial.part2.rar
NitroFlare
https://nitroflare.com/view/6512A1A39DF1E76/yxusj.Udemy.-.Grafana.Tutorial.part1.rar
https://nitroflare.com/view/B1AC7CA51E76774/yxusj.Udemy.-.Grafana.Tutorial.part2.rar
DDownload
https://ddownload.com/x2w32i7d1l7e/yxusj.Udemy.-.Grafana.Tutorial.part1.rar
https://ddownload.com/k3vt0a8v2oln/yxusj.Udemy.-.Grafana.Tutorial.part2.rar
We need your support!
Make a donation to help us stay online

Bitcoin (BTC)
bc1q08g9d22cxkawsjlf8etuek2pc9n2a3hs4cdrld

Bitcoin Cash (BCH)
qqvwexzhvgauxq2apgc4j0ewvcak6hh6lsnzmvtkem

Ethereum (ETH)
0xb55513D2c91A6e3c497621644ec99e206CDaf239

Litecoin (LTC)
ltc1qt6g2trfv9tjs4qj68sqc4uf0ukvc9jpnsyt59u

USDT (ERC20)
0xb55513D2c91A6e3c497621644ec99e206CDaf239

USDT (TRC20)
TYdPNrz7v1P9riWBWZ317oBgJueheGjATm
Information |
|||
 |
Users of GUESTS are not allowed to comment this publication. | ||