


Microsoft Excel Data Visualization With Management Technique
Category: Tutorials
- views: 102
- date: 13 August 2025
- posted by: 0nelove
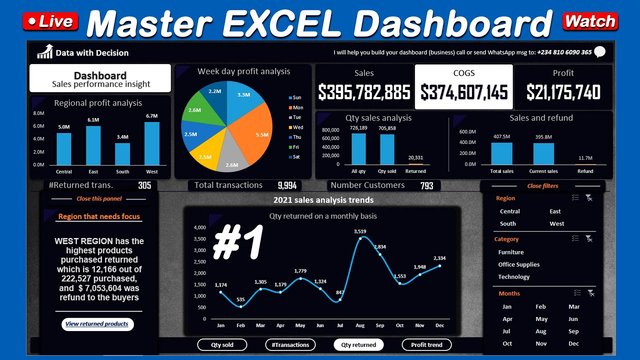
Microsoft Excel Data Visualization With Management Technique
Published 8/2025
MP4 | Video: h264, 1280x720 | Audio: AAC, 44.1 KHz, 2 Ch
Language: English | Duration: 2h 25m | Size: 1.41 GB
Learn to Create Powerful Excel Data Visualizations and Apply Proven Management Techniques for Smarter Decision Making
What you'll learn
Introduction to Microsoft Excel and the Interface
Navigating Worksheets and Working with Data
Basic Formatting: Fonts, Colors, and Borders
Working with Rows, Columns, and Cells
Understanding Formulas and Cell References
Logical Functions: IF, AND, OR, NOT
Lookup Functions: VLOOKUP, HLOOKUP, XLOOKUP
Date and Time Functions
Sorting and Filtering Data
Removing Duplicates and Data Validation
Using Flash Fill for Quick Data Entry
Creating Basic Charts: Bar, Line, and Pie Charts
Customizing Chart Styles and Layouts
Advanced Charts: Combo Charts, Sparklines, Waterfall Charts
Designing a Dashboard Layout
Using Named Ranges and Dynamic Formulas
Combining Charts, PivotTables, and Conditional Formatting
Avoiding Common Excel Mistakes
Essential Excel Shortcuts
Requirements
No prior experience with data visualization is needed! I'll start with the fundamentals and build from there.
Description
Microsoft Excel Data Visualization with Management TechniqueAre you tired of presenting confusing spreadsheets and hoping your audience understands the key takeaways? Do you want to build professional, interactive dashboards that impress your boss and influence critical business decisions?In this comprehensive, hands-on course, you'll go beyond the basics of Excel and master the art and science of data visualization with a powerful management focus. I'll show you how to turn raw data into a compelling story, using visuals to track performance, identify opportunities, and solve complex business problems.What You'll LearnMastering Excel's visualization tools — including PivotCharts, dynamic charts, sparklines, and conditional formatting.Designing professional dashboards that present complex data in a clear, decision friendly format.Applying management techniques such as KPI tracking, performance analysis, and workflow monitoring for real world business scenarios.Analyzing and communicating data effectively to stakeholders for strategic planning and performance improvement.Practical case studies and hands-on exercises to solidify your learning and prepare you for workplace application.By the end of the course, you'll have the skills to not only create compelling Excel visuals but also use them as powerful management tools to influence strategy, monitor progress, and achieve business goals.No matter your current skill level, this course will take you from understanding basic charts to confidently building data driven dashboards with a management oriented mindset.
Who this course is for
Anyone who uses Excel: If you work with data and want to transform your static spreadsheets into dynamic, decision making tools, this course is for you.
Financial Analysts & Accountants: Go beyond traditional reports and create stunning visuals that reveal hidden insights in financial data.
Marketing & Sales Professionals: Track campaign performance, analyze sales funnels, and communicate results with powerful visual reports.
Managers & Team Leaders: Gain the ability to monitor team performance, present data-driven reports, and make more informed decisions.
Buy Premium From My Links To Get Resumable Support and Max Speed
https://rapidgator.net/file/d15ba67a647ea0f564a362a6387ac99d/Microsoft_Excel_Data_Visualization_with_Management_Technique.part2.rar.html
https://rapidgator.net/file/9c644fdc5cb3078bb973d18b7d1d7c5a/Microsoft_Excel_Data_Visualization_with_Management_Technique.part1.rar.html
https://nitroflare.com/view/A03733775B1F340/Microsoft_Excel_Data_Visualization_with_Management_Technique.part2.rar
https://nitroflare.com/view/E7387EFB1C8E9E7/Microsoft_Excel_Data_Visualization_with_Management_Technique.part1.rar
https://rapidgator.net/file/d15ba67a647ea0f564a362a6387ac99d/Microsoft_Excel_Data_Visualization_with_Management_Technique.part2.rar.html
https://rapidgator.net/file/9c644fdc5cb3078bb973d18b7d1d7c5a/Microsoft_Excel_Data_Visualization_with_Management_Technique.part1.rar.html
https://nitroflare.com/view/A03733775B1F340/Microsoft_Excel_Data_Visualization_with_Management_Technique.part2.rar
https://nitroflare.com/view/E7387EFB1C8E9E7/Microsoft_Excel_Data_Visualization_with_Management_Technique.part1.rar
We need your support!
Make a donation to help us stay online

Bitcoin (BTC)
bc1q08g9d22cxkawsjlf8etuek2pc9n2a3hs4cdrld

Bitcoin Cash (BCH)
qqvwexzhvgauxq2apgc4j0ewvcak6hh6lsnzmvtkem

Ethereum (ETH)
0xb55513D2c91A6e3c497621644ec99e206CDaf239

Litecoin (LTC)
ltc1qt6g2trfv9tjs4qj68sqc4uf0ukvc9jpnsyt59u

USDT (ERC20)
0xb55513D2c91A6e3c497621644ec99e206CDaf239

USDT (TRC20)
TYdPNrz7v1P9riWBWZ317oBgJueheGjATm
Information |
|||
 |
Users of GUESTS are not allowed to comment this publication. | ||