


Interactive Map Visualization With Kepler Gl And Streamlit
Category: Tutorials
- views: 163
- date: 19 January 2025
- posted by: AD-TEAM
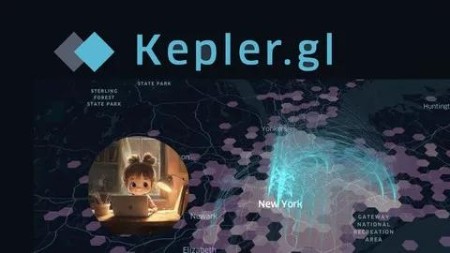
Interactive Map Visualization With Kepler Gl And Streamlit
Published 11/2024
MP4 | Video: h264, 1920x1080 | Audio: AAC, 44.1 KHz
Language: English | Size: 2.33 GB | Duration: 2h 55m
Visualizing and Analyzing Geospatial Data with Kepler GL, Sharing with Streamlit, and Customizing Map Styles with Mapbox
What you'll learn
Mastering Kepler GL UI: Use the Kepler GL demo to understand the basics of the UI and how to interact with it for map visualization tasks.
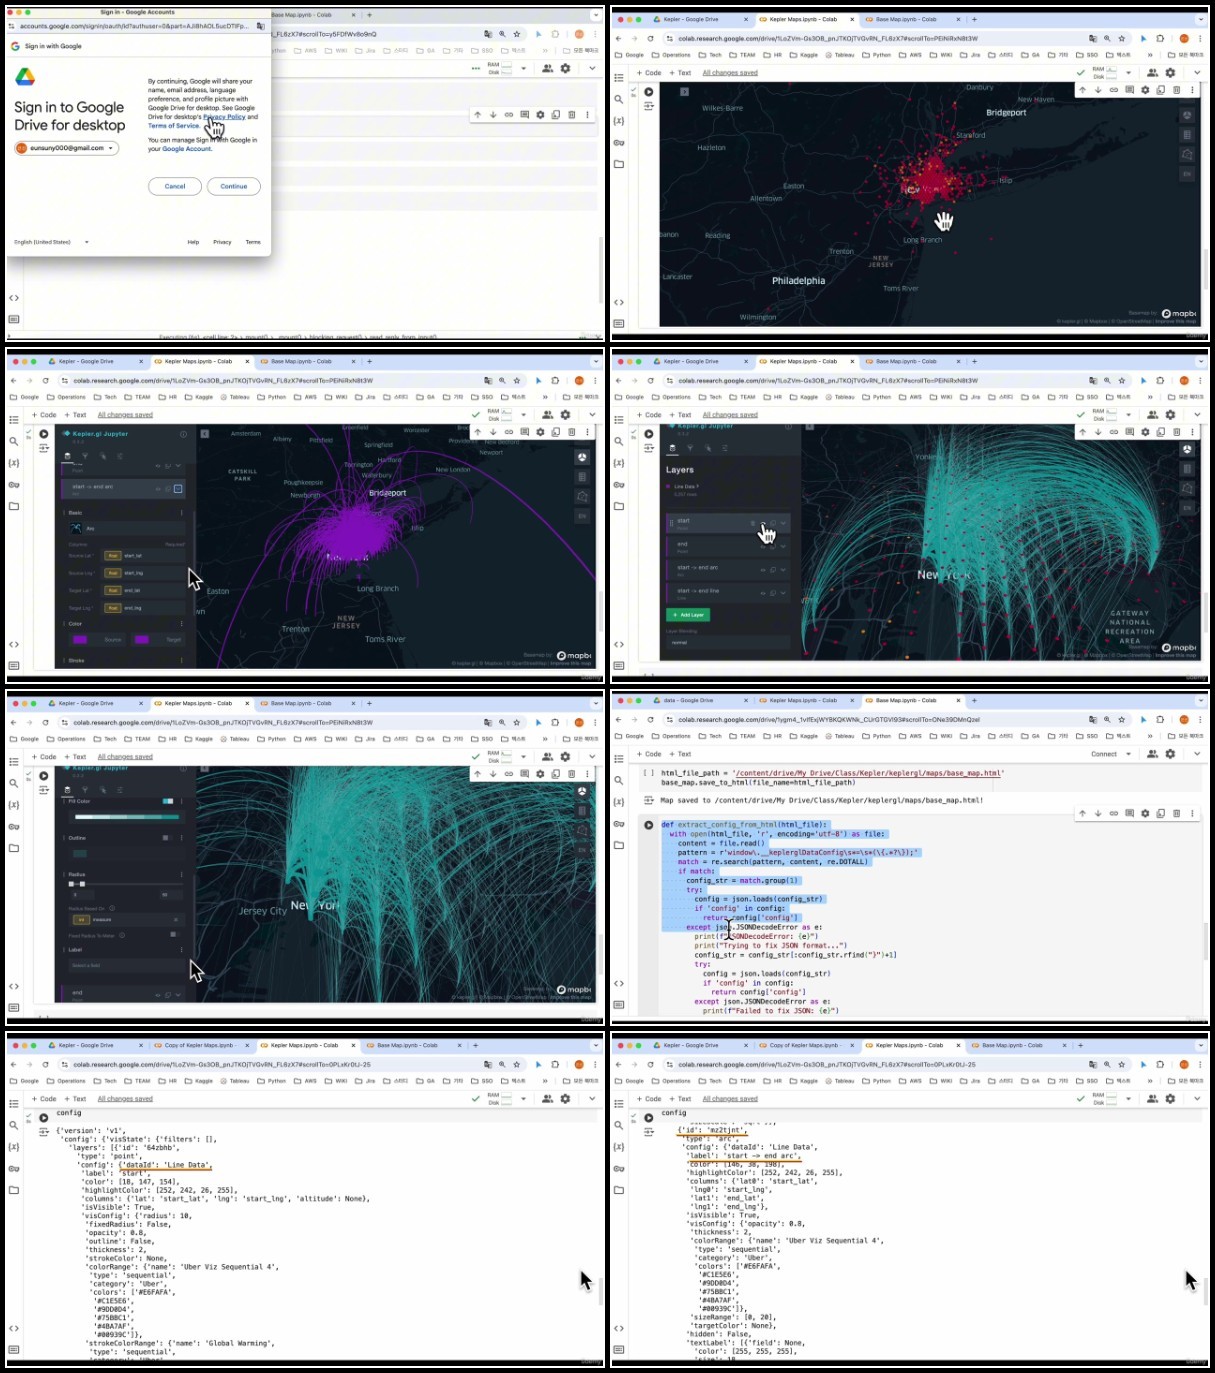
Kepler GL Config Extraction: Visualize various data types (Basic Map, Boundary, Point, H3, Line), and extract their configurations.
Sharing Map Visualizations with Streamlit: Use Streamlit to share maps with other users effectively.
Customizing Map Styles with Mapbox: Apply custom map styles using Mapbox to create unique and personalized visualizations.
H3 Data Generation: Learn how to convert point data into hexagon data, preparing for efficient spatial data visualization.
Requirements
Basic Python skills required: Familiarity with Python, pip for library installation, and basic GitHub usage will make it easier to follow this course.
Description
open event code: EMAIL10Through this course, you will learn how to visualize large-scale geospatial data using Kepler GL, and easily share interactive map visualizations using Streamlit.Kepler GL is an open-source tool developed by Uber to efficiently analyze and visualize complex geospatial data in real time.Streamlit is a Python framework that allows you to easily create interactive web applications, particularly useful when visualizing data or building dashboards.In this course, you will achieve the following goals:Mastering the Kepler Demo UI: Without writing code, you will directly interact with the Kepler GL interface and experience its various features, gaining a basic understanding of data visualization.Creating Map Visualizations with Kepler GL: Using Google Colab, you will write code to generate map visualizations with Kepler GL. You will learn how to extract visualization settings and use them to customize maps according to your needs.Sharing Map Visualizations with Streamlit: You will learn how to share interactive map visualizations with others using Streamlit, making it easy for users to view the maps and perform spatial analysis without any extra effort.Applying Custom Map Styles with Mapbox: You will overcome the limitations of the default map styles by applying custom map styles with Mapbox to represent geographical details more richly and accurately.
Overview
Section 1: Course Introduction and Data Preparation
Lecture 1 Course Introduction
Lecture 2 Data Sources
Lecture 3 H3 Data Generation
Lecture 4 Code and Data for this course
Section 2: Mastering the Kepler Demo UI
Lecture 5 Interacting with Kepler Demo UI without Code
Section 3: KeplerGL Map Visualizations and and Config Extraction
Lecture 6 Why Experiment in Google Colab?
Lecture 7 Base Map and Config Extraction
Lecture 8 Boundary Layer and Config Extraction
Lecture 9 Point Layer and Config Extraction
Lecture 10 H3 Layer and Config Extraction
Lecture 11 Line Layer and Config Extraction
Lecture 12 Organizing Extracted Config
Section 4: Sharing Map Visualizations with Streamlit
Lecture 13 Streamlit Basics
Lecture 14 Displaying a Base Map in Streamlit
Lecture 15 Adding Boundary Layers to the Map
Lecture 16 Adding Point Layers to the Map
Lecture 17 Adding H3 Layers to the Map
Lecture 18 Adding Line Layers to the Map
Lecture 19 Setting the Layer Order
Lecture 20 Deploying an App with Streamlit Cloud
Section 5: Applying Custom Map Styles with Mapbox
Lecture 21 Applying Custom Map Styles with Mapbox
Lecture 22 Troubleshooting Mapbox Style Issues
For those interested in using Kepler GL: Learn to efficiently process large-scale location data and visualize various types of data.,For those interested in using Streamlit: Easily deploy web applications and build user-friendly map interfaces.,For those interested in using Mapbox: Apply custom map styles to create tailored maps that fit project requirements.,For those wanting to learn the complete workflow of map visualization: Master the entire process, including data preparation, visualization, style application, sharing, and deployment.,For those interested in spatial analysis: Explore how to create interactive maps and analyze geographic data to gain deeper insights.
RapidGator
AlfaFile
TurboBit
We need your support!
Make a donation to help us stay online

Bitcoin (BTC)
bc1q08g9d22cxkawsjlf8etuek2pc9n2a3hs4cdrld

Bitcoin Cash (BCH)
qqvwexzhvgauxq2apgc4j0ewvcak6hh6lsnzmvtkem

Ethereum (ETH)
0xb55513D2c91A6e3c497621644ec99e206CDaf239

Litecoin (LTC)
ltc1qt6g2trfv9tjs4qj68sqc4uf0ukvc9jpnsyt59u

USDT (ERC20)
0xb55513D2c91A6e3c497621644ec99e206CDaf239

USDT (TRC20)
TYdPNrz7v1P9riWBWZ317oBgJueheGjATm
Information |
|||
 |
Users of GUESTS are not allowed to comment this publication. | ||