


Six Sigma Statistics With Minitab: Box Plot Analysis
Category: Tutorials
- views: 456
- date: 15 January 2025
- posted by: AD-TEAM
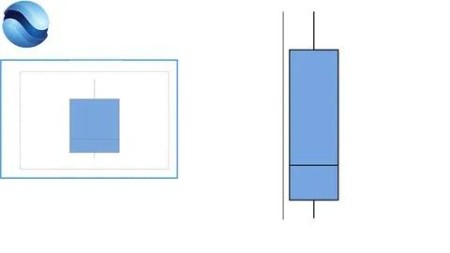
Six Sigma Statistics With Minitab: Box Plot Analysis
Published 12/2024
MP4 | Video: h264, 1920x1080 | Audio: AAC, 44.1 KHz
Language: English | Size: 235.97 MB | Duration: 0h 2m
Master Six Sigma Statistics with Minitab – Taught by Prof. Dr. Murat Mola, Germany's Professor of the Year!
What you'll learn
Fundamentals of Box Plot Analysis: How to create and interpret box plots to identify differences and trends in categorical data groups.
Data Preparation and Cleansing: Working with real-world datasets, including data cleaning, extraction, and subset formation.
Analysis of Production Metrics: Applying box plot analysis to production-related metrics to detect specific trends and anomalies.
Identifying Optimization Potential: Analyzing daily differences in scrap rates to uncover opportunities for process improvement.
Practical Evaluation: Utilizing the analysis results to support decisions and actions within quality management and optimization projects.
Requirements
No prior knowledge is required to participate in this course
Description
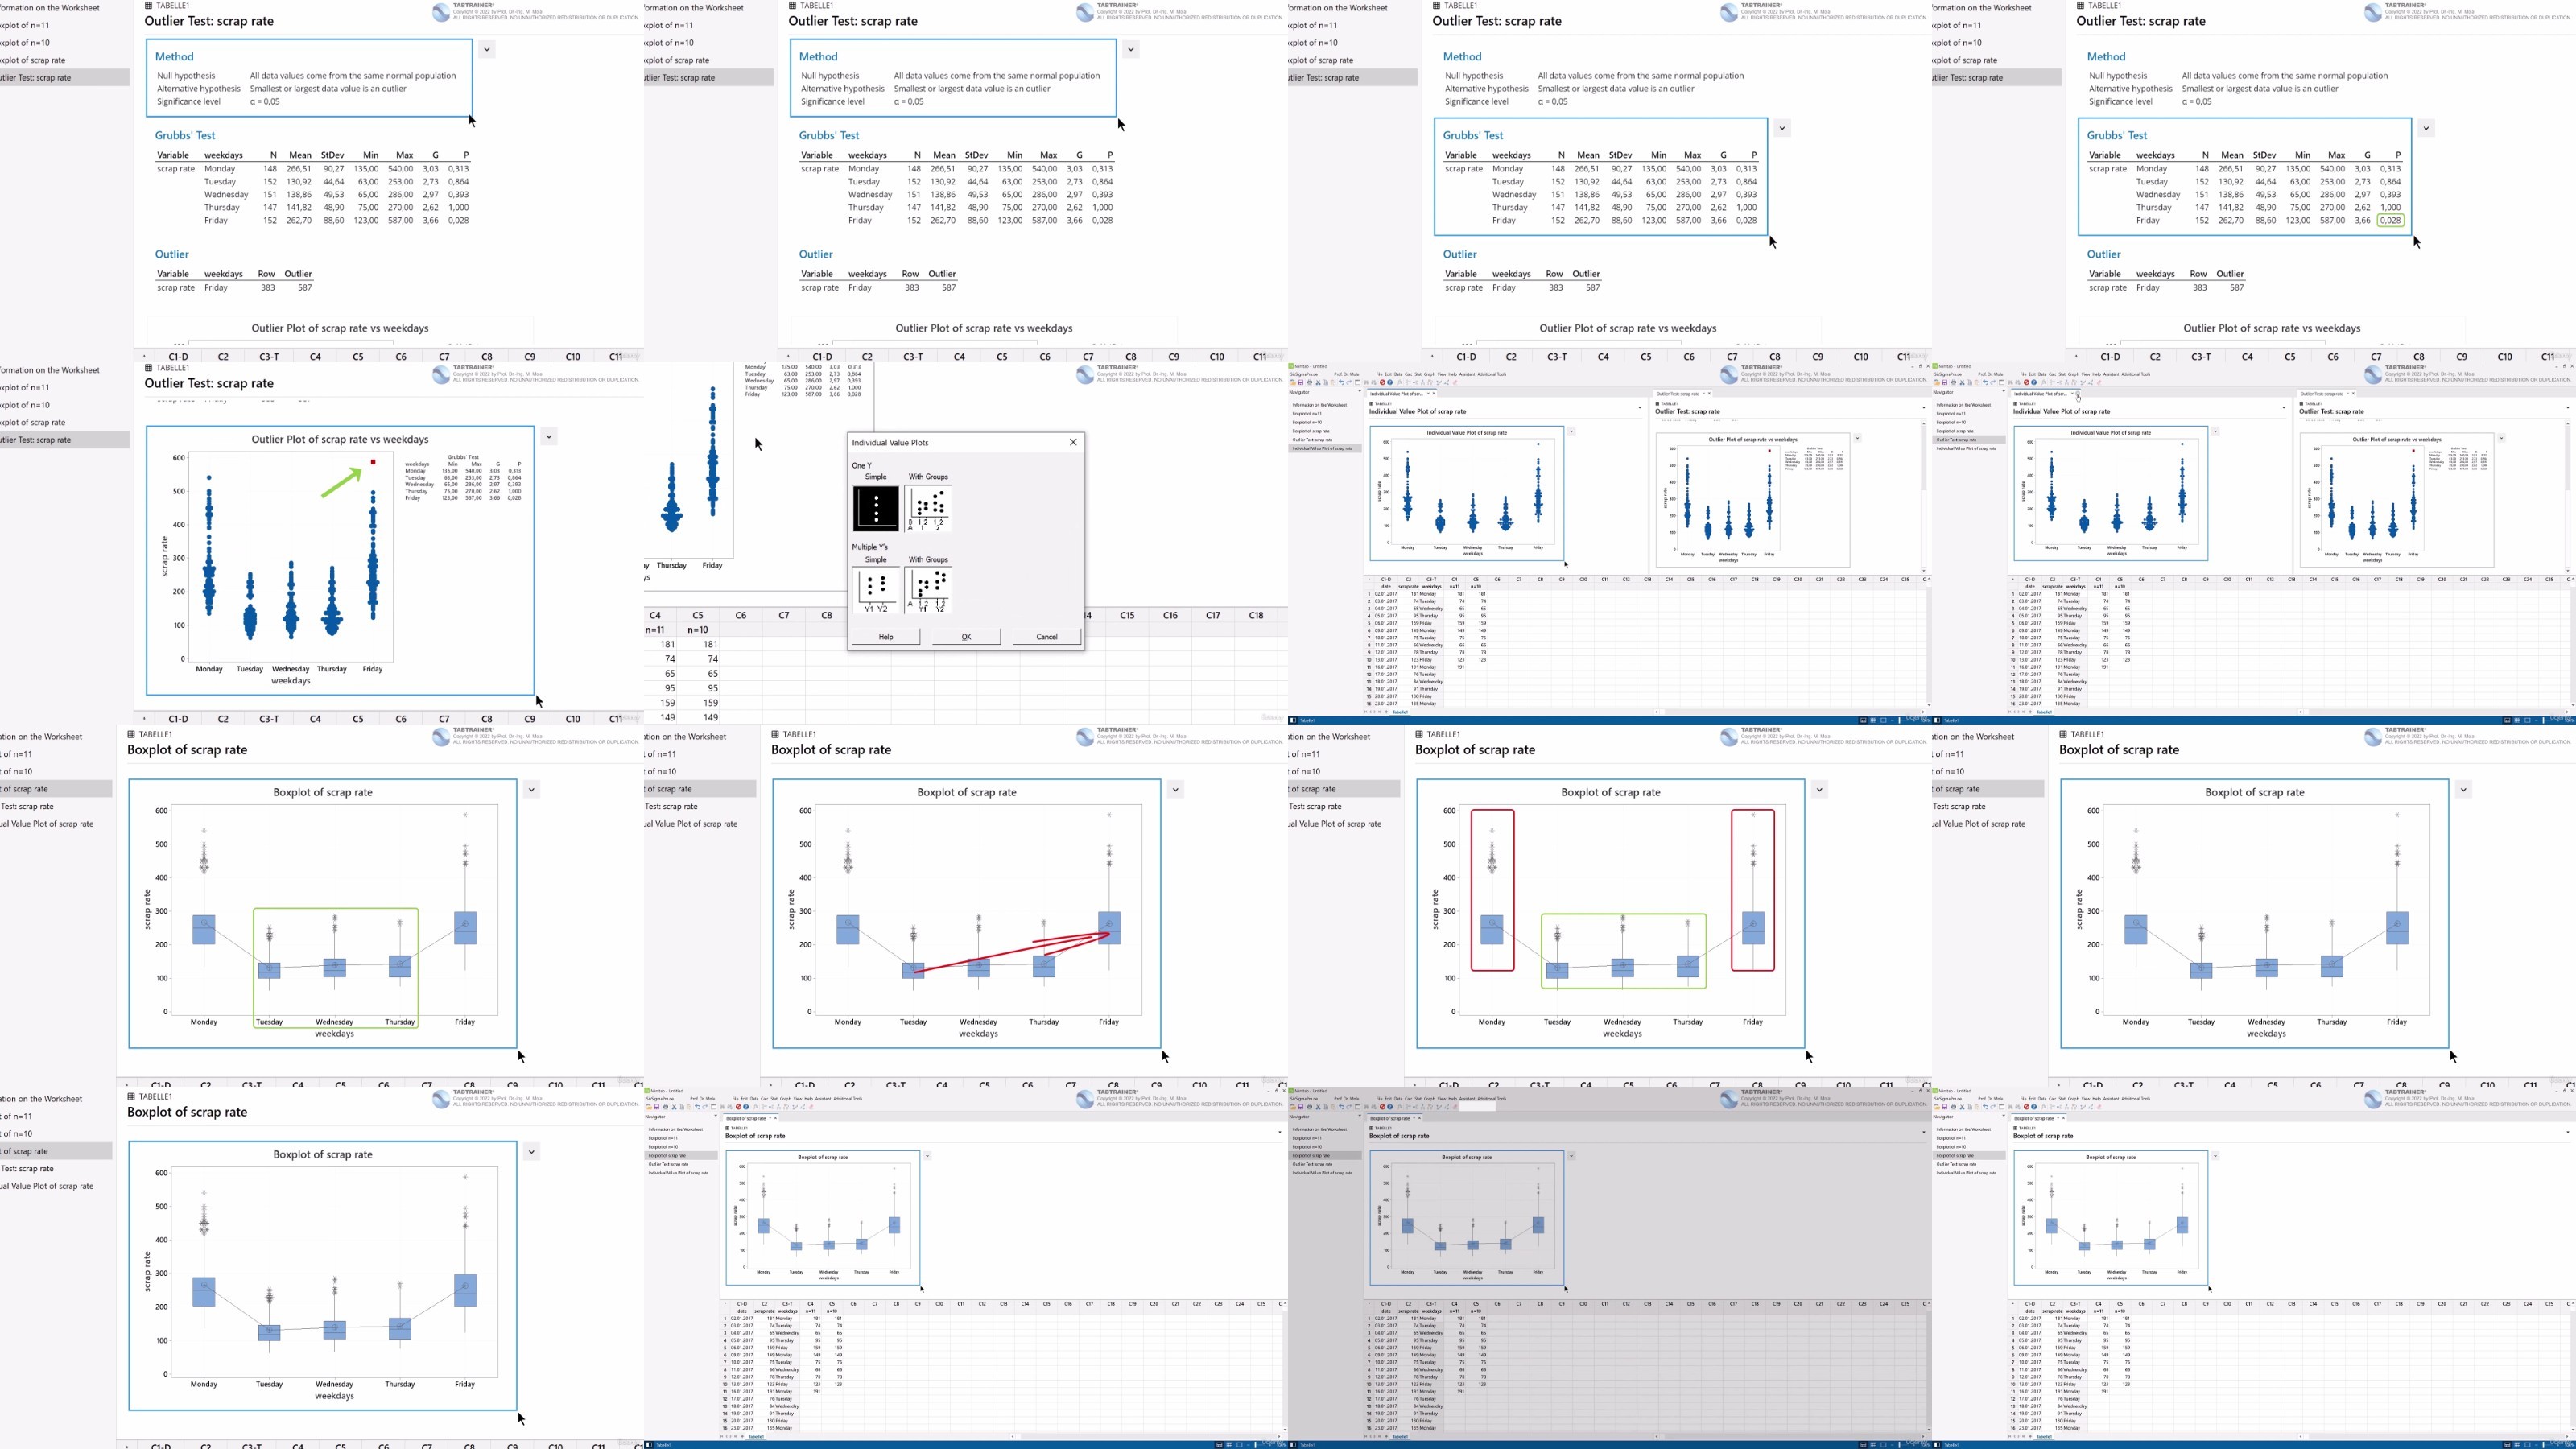
This training unit provides a comprehensive exploration of Box Plot Analysis to identify trends and differences in categorical data groups. Designed for professionals in quality management, this course uses real-world scenarios from the Smartboard Company to demonstrate the analysis of production scrap rates across weekdays.Participants will work with a pre-processed dataset containing 750 values representing daily scrap rates. Through hands-on exercises, participants will learn to construct, interpret, and customize box plots to uncover valuable insights for process optimization.Key Learning Objectives:Understand the fundamentals of Box Plot Analysis, including the calculation of quartiles, median, and interquartile range (IQR).Explore the four types of box plots and their application based on categorical and response variables.Identify production trends and variability, such as higher scrap rates on specific weekdays, using statistical tools.Conduct an Outlier Analysis with Grubbs' Test to detect anomalies and validate their causes.Create and use Individual Value Plots for detailed data visualization.Advanced Skills Development:Automate repetitive analyses (e.g., box plots, outlier tests) by creating macros in Exec format using the Command Line History.Customize a new Daily Quality Analysis menu for one-click execution of recurring tasks, enhancing efficiency in routine operations.Incorporate additional statistical elements, such as arithmetic mean and trend lines, into visualizations.Practical Application: Participants will analyze weekday-specific box plots to identify and address production inconsistencies. The course also emphasizes:The importance of stable production processes across the week.Techniques to streamline workflows with automated Minitab macros.Saving and exporting project results for consistent reporting.This hands-on course equips participants with essential tools and techniques to optimize quality processes using Minitab, ensuring robust, repeatable statistical analyses in dynamic business environments.
Overview
Section 1: Boxplot Analysis with Minitab
Lecture 1 Business case for Box Plot Analysis
Lecture 2 Box Plot Analysis: Uncovering Trends in Production Scrap Rates
Lecture 3 Creating and Interpreting Box Plots with Odd Sample Sizes
Lecture 4 Mastering Box Plot Analysis: Comparing Scrap Rates Across Weekdays
Lecture 5 Streamlining Quality Analysis: Outliers, Trends, and Automation with Box Plots
Lecture 6 Enhancing Efficiency with Automated Macros in Minitab
Lecture 7 Key Takeaways: Streamlining Quality Analysis with Box Plots and Automation
Quality Managers and Quality Engineers,Process Optimizers and Lean Six Sigma Practitioners,Production Managers and Manufacturing Engineers,Data Analysts and Business Analysts with a Production Focus,Beginners in Data Analysis or Quality Management
RapidGator
AlfaFile
TurboBit
We need your support!
Make a donation to help us stay online

Bitcoin (BTC)
bc1q08g9d22cxkawsjlf8etuek2pc9n2a3hs4cdrld

Bitcoin Cash (BCH)
qqvwexzhvgauxq2apgc4j0ewvcak6hh6lsnzmvtkem

Ethereum (ETH)
0xb55513D2c91A6e3c497621644ec99e206CDaf239

Litecoin (LTC)
ltc1qt6g2trfv9tjs4qj68sqc4uf0ukvc9jpnsyt59u

USDT (ERC20)
0xb55513D2c91A6e3c497621644ec99e206CDaf239

USDT (TRC20)
TYdPNrz7v1P9riWBWZ317oBgJueheGjATm
Information |
|||
 |
Users of GUESTS are not allowed to comment this publication. | ||