


Data Visualization: Best Practices
Category: Tutorials
- views: 148
- date: 26 October 2024
- posted by: AD-TEAM

Data Visualization: Best Practices
Duration: 1h 38m | .MP4 1280x720, 30 fps(r) | AAC, 48000 Hz, 2ch | 860 MB
Genre: eLearning | Language: English
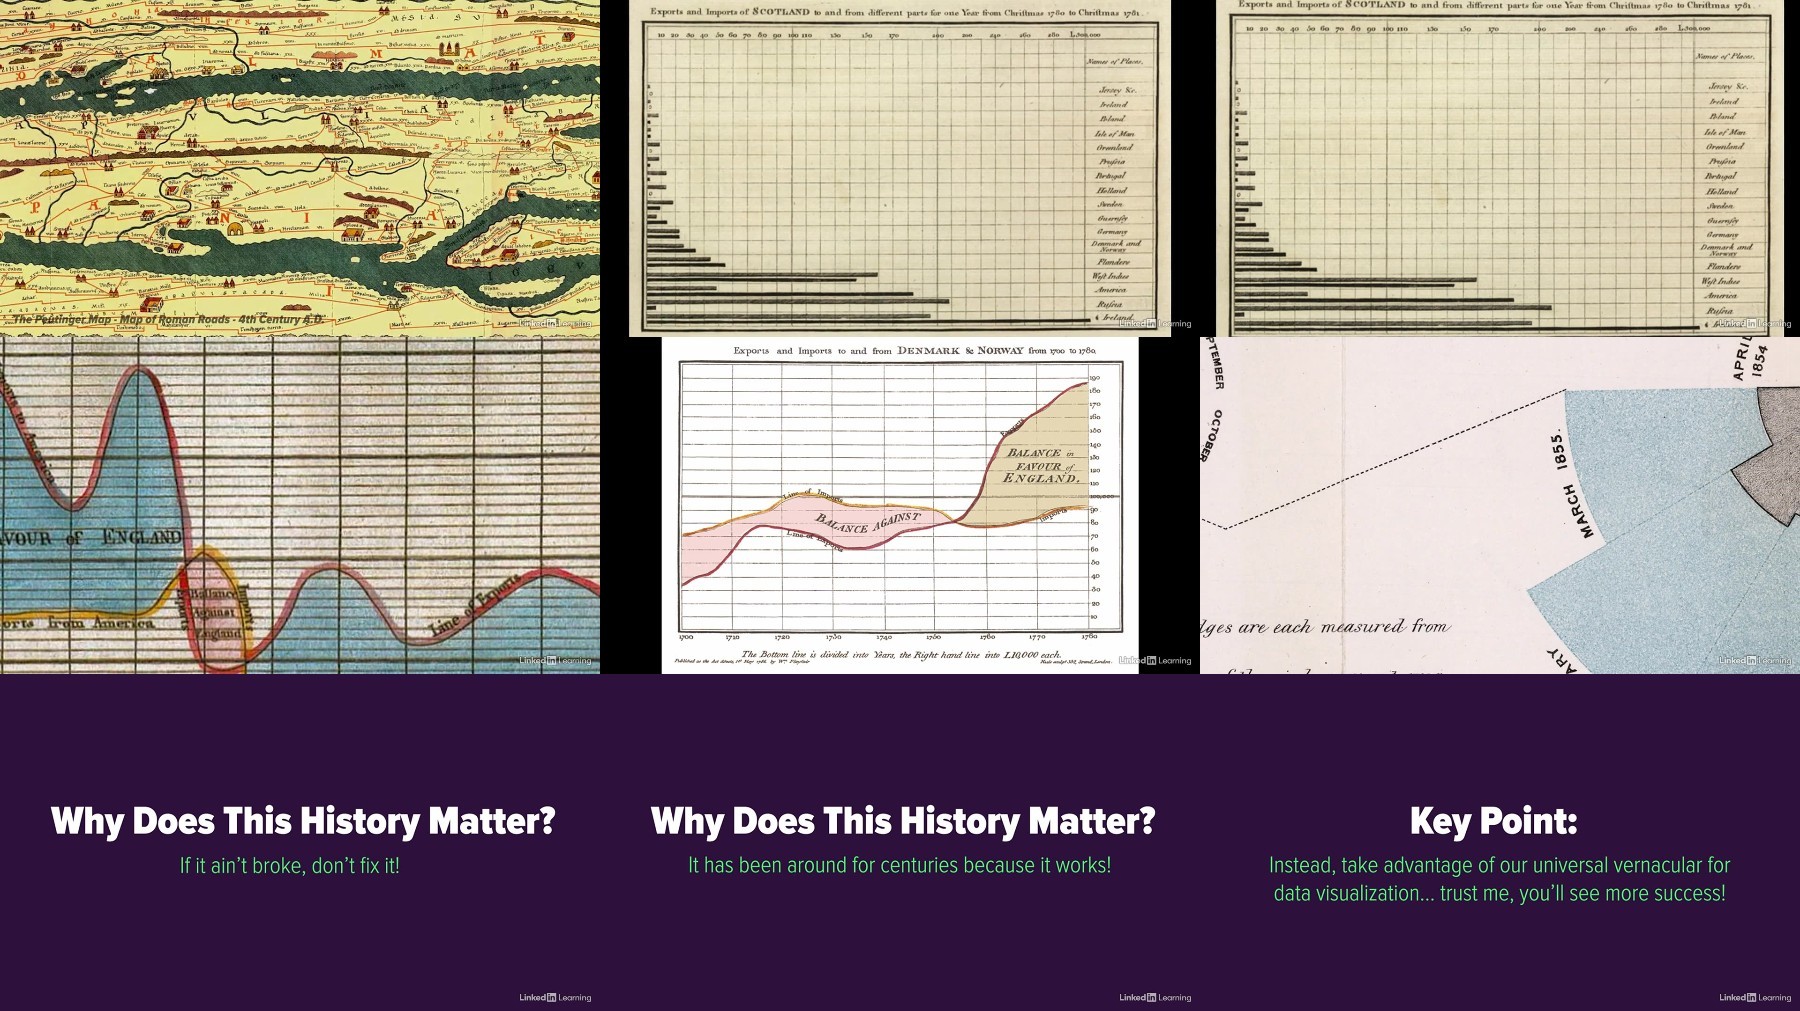
Media and marketing efforts often rely on data visualizations to prove a point quickly. But poorly designed visualizations can be misleading and can even become a source of global scrutiny. To succeed in design and marketing today, you need to know how to interpret and properly visualize data. This course, developed and led by Killer Infographics CEO, Amy Balliett, walks you through the ins and outs of creating accurate and compelling data visualizations. She shows you how to identify and shape your data with key questions, as well as how to avoid common data visualization mistakes. Amy covers creating bar graphs, pie charts, line graphs, and area graphs in Adobe Illustrator and goes over how to better contextualize your data visualizations with labels and color. Using these tips, you'll learn how to stand out from the crowd and create charts and graphs that combine precision with visual appeal.
More Info
More Info
We need your support!
Make a donation to help us stay online

Bitcoin (BTC)
bc1q08g9d22cxkawsjlf8etuek2pc9n2a3hs4cdrld

Bitcoin Cash (BCH)
qqvwexzhvgauxq2apgc4j0ewvcak6hh6lsnzmvtkem

Ethereum (ETH)
0xb55513D2c91A6e3c497621644ec99e206CDaf239

Litecoin (LTC)
ltc1qt6g2trfv9tjs4qj68sqc4uf0ukvc9jpnsyt59u

USDT (ERC20)
0xb55513D2c91A6e3c497621644ec99e206CDaf239

USDT (TRC20)
TYdPNrz7v1P9riWBWZ317oBgJueheGjATm
Information |
|||
 |
Users of GUESTS are not allowed to comment this publication. | ||