


Coursera - Applied Plotting, Charting & Data Representation in Python
Category: Tutorials
- views: 135
- date: 28 September 2024
- posted by: AD-TEAM
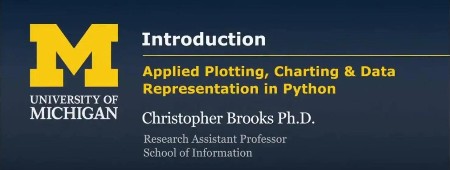
Coursera - Applied Plotting, Charting & Data Representation in Python
Size: 281.07 MB | Duration: 4 hours | Video: AVC (.mp4) 960x540 29.97fps | Audio: AAC 44KHz 1ch
Genre: eLearning | Level: Intermediate | Language: English
This course will introduce the learner to information visualization basics, with a focus on reporting and charting using the matplotlib library. The course will start with a design and information literacy perspective, touching on what makes a good and bad visualization, and what statistical measures translate into in terms of visualizations.
The second week will focus on the technology used to make visualizations in python, matplotlib, and introduce users to best practices when creating basic charts and how to realize design decisions in the framework. The third week will describe the gamut of functionality available in matplotlib, and demonstrate a variety of basic statistical charts helping learners to identify when a particular method is good for a particular problem. The course will end with a discussion of other forms of structuring and visualizing data.
This course should be taken after Introduction to Data Science in Python and before the remainder of the Applied Data Science with Python courses: Applied Machine Learning in Python, Applied Text Mining in Python, and Applied Social Network Analysis in Python.
Course 2 of 5 in Applied Data Science with Python (University of Michigan 2017).
Enjoy My Blog | Subscribe My RSS Channel
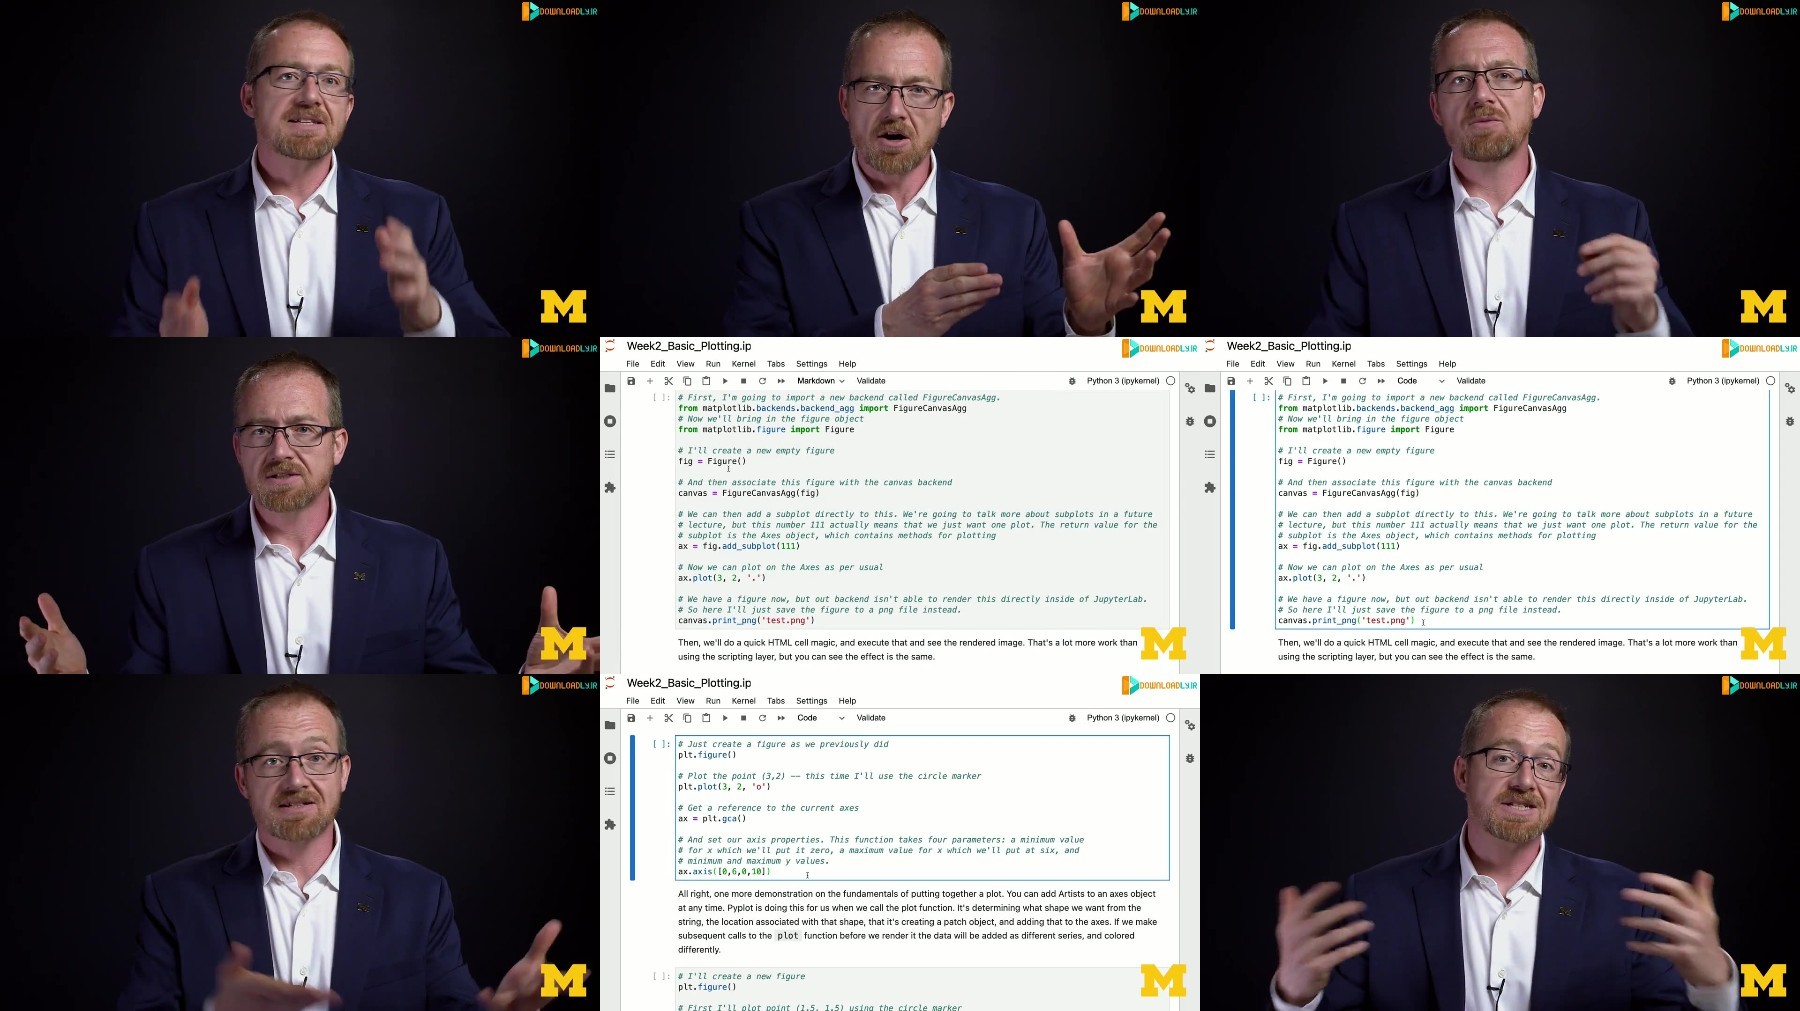
The second week will focus on the technology used to make visualizations in python, matplotlib, and introduce users to best practices when creating basic charts and how to realize design decisions in the framework. The third week will describe the gamut of functionality available in matplotlib, and demonstrate a variety of basic statistical charts helping learners to identify when a particular method is good for a particular problem. The course will end with a discussion of other forms of structuring and visualizing data.
This course should be taken after Introduction to Data Science in Python and before the remainder of the Applied Data Science with Python courses: Applied Machine Learning in Python, Applied Text Mining in Python, and Applied Social Network Analysis in Python.
Course 2 of 5 in Applied Data Science with Python (University of Michigan 2017).
Enjoy My Blog | Subscribe My RSS Channel
We need your support!
Make a donation to help us stay online

Bitcoin (BTC)
bc1q08g9d22cxkawsjlf8etuek2pc9n2a3hs4cdrld

Bitcoin Cash (BCH)
qqvwexzhvgauxq2apgc4j0ewvcak6hh6lsnzmvtkem

Ethereum (ETH)
0xb55513D2c91A6e3c497621644ec99e206CDaf239

Litecoin (LTC)
ltc1qt6g2trfv9tjs4qj68sqc4uf0ukvc9jpnsyt59u

USDT (ERC20)
0xb55513D2c91A6e3c497621644ec99e206CDaf239

USDT (TRC20)
TYdPNrz7v1P9riWBWZ317oBgJueheGjATm
Information |
|||
 |
Users of GUESTS are not allowed to comment this publication. | ||