


InfluxDB for Time Series dаta: Ingest, Analyze, and Visualize Data
Category: Tutorials
- views: 82
- date: 20 September 2024
- posted by: AD-TEAM
InfluxDB for Time Series dаta: Ingest, Analyze, and Visualize Data
Duration: 1h 8m | .MP4 1280x720, 30 fps(r) | AAC, 48000 Hz, 2ch | 150 MB
Genre: eLearning | Language: English
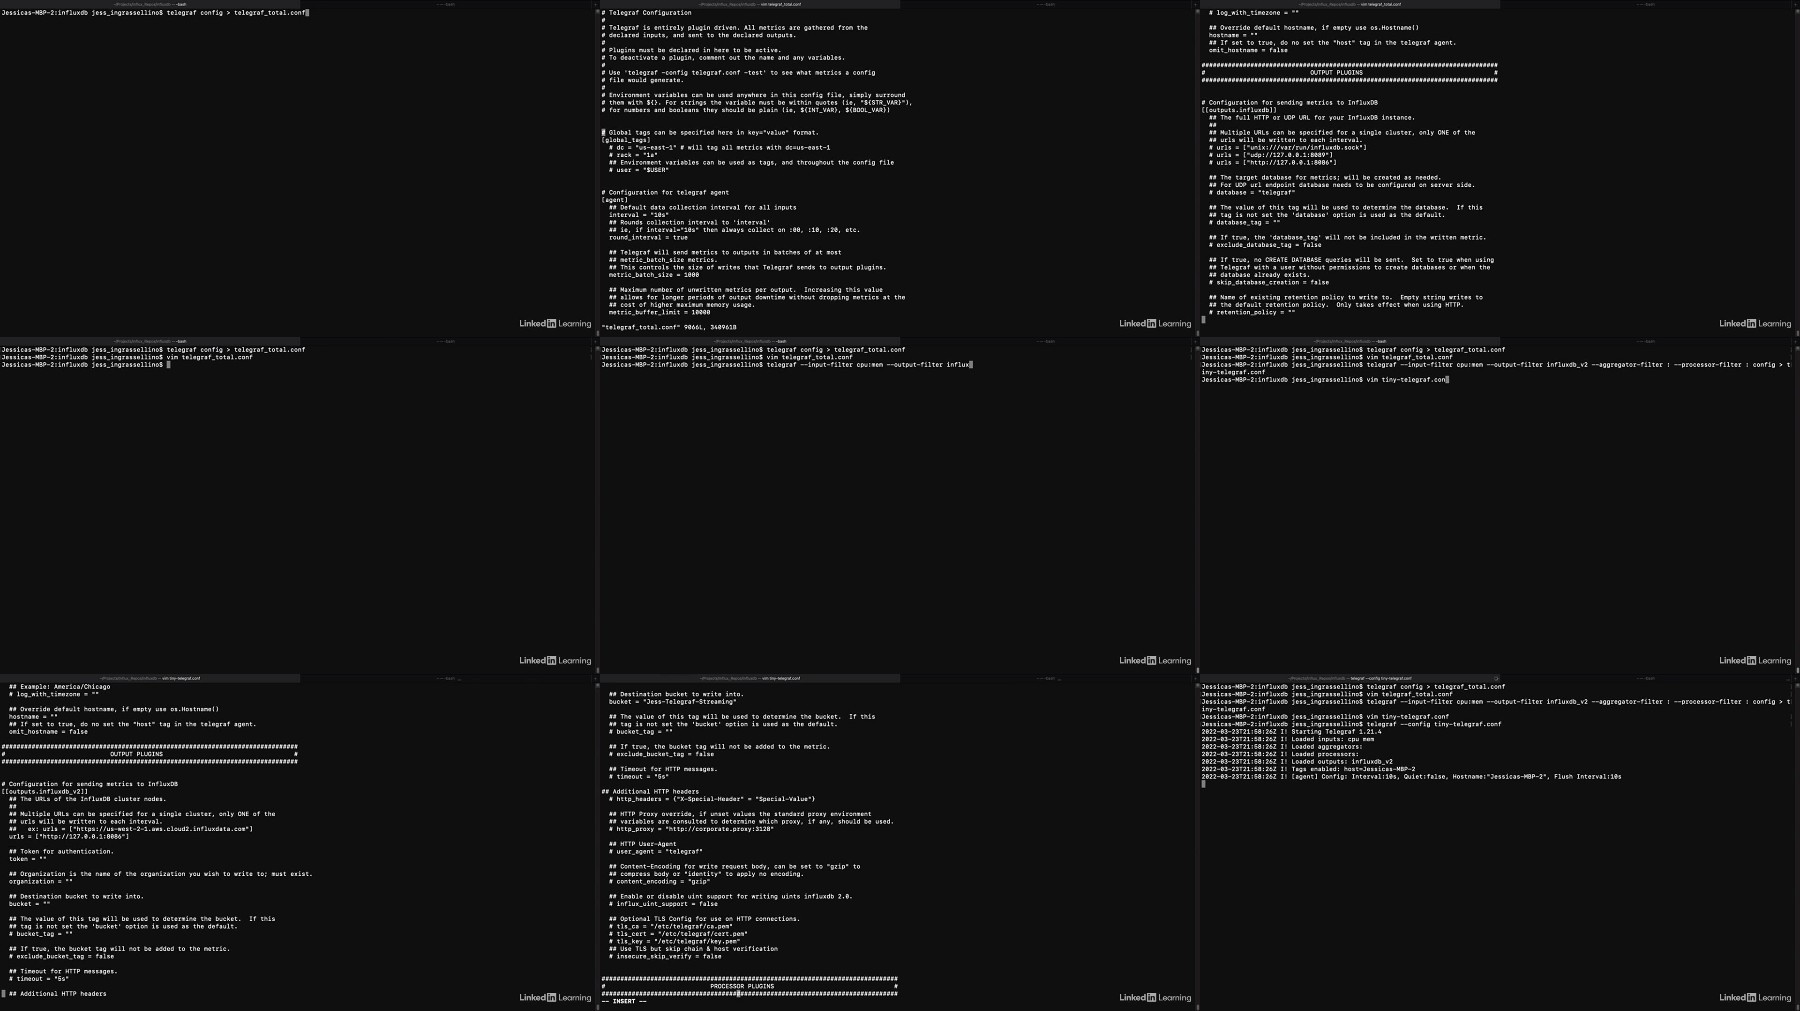
Time series data—a data set that tracks a sample over time—is constantly being generated all around us. From data that powers financial markets and health and science institutions, to our cars, personal technology, and smart home devices, time series data allows us to gain insights into data from moment to moment or aggregate data to learn about trends based on a period of time. In this course, Jess Ingrassellino shows you how to gain insights into time series data by using InfluxDB, a database designed to ingest, analyze, and visualize time series data. Jess shows you how to navigate the InfluxDB cloud UI, covers several methods for bringing your data into InfluxDB, and then explains how to query your data to get meaningful insights.
More Info
More Info
We need your support!
Make a donation to help us stay online

Bitcoin (BTC)
bc1q08g9d22cxkawsjlf8etuek2pc9n2a3hs4cdrld

Bitcoin Cash (BCH)
qqvwexzhvgauxq2apgc4j0ewvcak6hh6lsnzmvtkem

Ethereum (ETH)
0xb55513D2c91A6e3c497621644ec99e206CDaf239

Litecoin (LTC)
ltc1qt6g2trfv9tjs4qj68sqc4uf0ukvc9jpnsyt59u

USDT (ERC20)
0xb55513D2c91A6e3c497621644ec99e206CDaf239

USDT (TRC20)
TYdPNrz7v1P9riWBWZ317oBgJueheGjATm
Information |
|||
 |
Users of GUESTS are not allowed to comment this publication. | ||