


Data Science For Sports - Sports Analytics And Visualization
Category: Tutorials
- views: 89
- date: 30 August 2024
- posted by: mitsumi
Data Science For Sports - Sports Analytics And Visualization

MP4 | Video: h264, 1280x720 | Audio: AAC, 44.1 KHz
Language: English (US) | Size: 919.00 MB | Duration: 1h 9m
Learn how to perform sports analytics and visualization using Python.
Language: English (US) | Size: 919.00 MB | Duration: 1h 9m
Learn how to perform sports analytics and visualization using Python.
What you'll learn
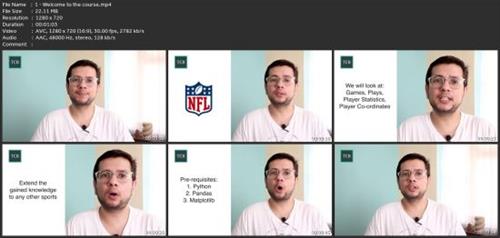
Learn how to perform analysis of different kinds of sports data using the 2018 NFL season data.
Learn how to visualize sports statistics.
Learn how to create a sports field and visualize players on top of it.
Learn how to standardize sports data.
Requirements
Basic understanding of Python, Pandas and Matplotlib.
Description
Are you a fan of sport but also interested in the numbers? Deep dive into the world of sports analytics with this course on 'Data Science for Sports - Sports Analytics and Visualization', created by The Click Reader. This course provides insights and knowledge into how you can perform analysis on sports data and then, visualize it using Python. We will start the course by looking at the games in the 2018 NFL season. Then, we will move on to look at the player statistics in order to understand the players in the season. We will also look at the plays of the NFL season and finally, end the course by building a data visualization project where we will be visualizing the American Football Field and players on top of it.After completing this course, you will be able to play around with the various available datasets and visualize them in different ways. This course contains hands-on exercises at the end of each lecture and the knowledge you gain through this course can be extended to any other domain of sports. Why you should take this course?Updated 2022 course content: All our course content is updated as per the latest technologies and tools available in the marketPractical hands-on knowledge: This course is oriented to providing a step-by-step implementation guide rather than just sticking to the theory.Guided support: We are always there to guide you through the Q/As so feel free to ask us your queries.
Who this course is for
Any developer looking to learn how to analyze and visualize sports data using Python.
Screenshots
rapidgator.net:
nitroflare.com:
We need your support!
Make a donation to help us stay online

Bitcoin (BTC)
bc1q08g9d22cxkawsjlf8etuek2pc9n2a3hs4cdrld

Bitcoin Cash (BCH)
qqvwexzhvgauxq2apgc4j0ewvcak6hh6lsnzmvtkem

Ethereum (ETH)
0xb55513D2c91A6e3c497621644ec99e206CDaf239

Litecoin (LTC)
ltc1qt6g2trfv9tjs4qj68sqc4uf0ukvc9jpnsyt59u

USDT (ERC20)
0xb55513D2c91A6e3c497621644ec99e206CDaf239

USDT (TRC20)
TYdPNrz7v1P9riWBWZ317oBgJueheGjATm
Information |
|||
 |
Users of GUESTS are not allowed to comment this publication. | ||