


Data Visualization for Data Analysis and Analytics
Category: Tutorials
- views: 220
- date: 19 June 2024
- posted by: AD-TEAM
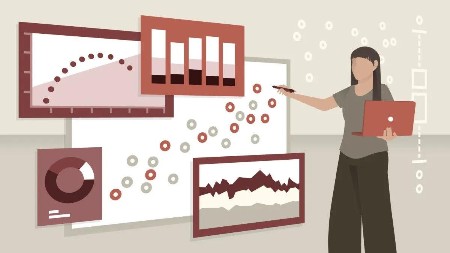
Data Visualization for Data Analysis and Analytics
Released: 6/14/2024
Duration: 1h 44m | .MP4 1280x720, 30 fps(r) | AAC, 48000 Hz, 2ch | 225 MB
Genre: eLearning | Language: English
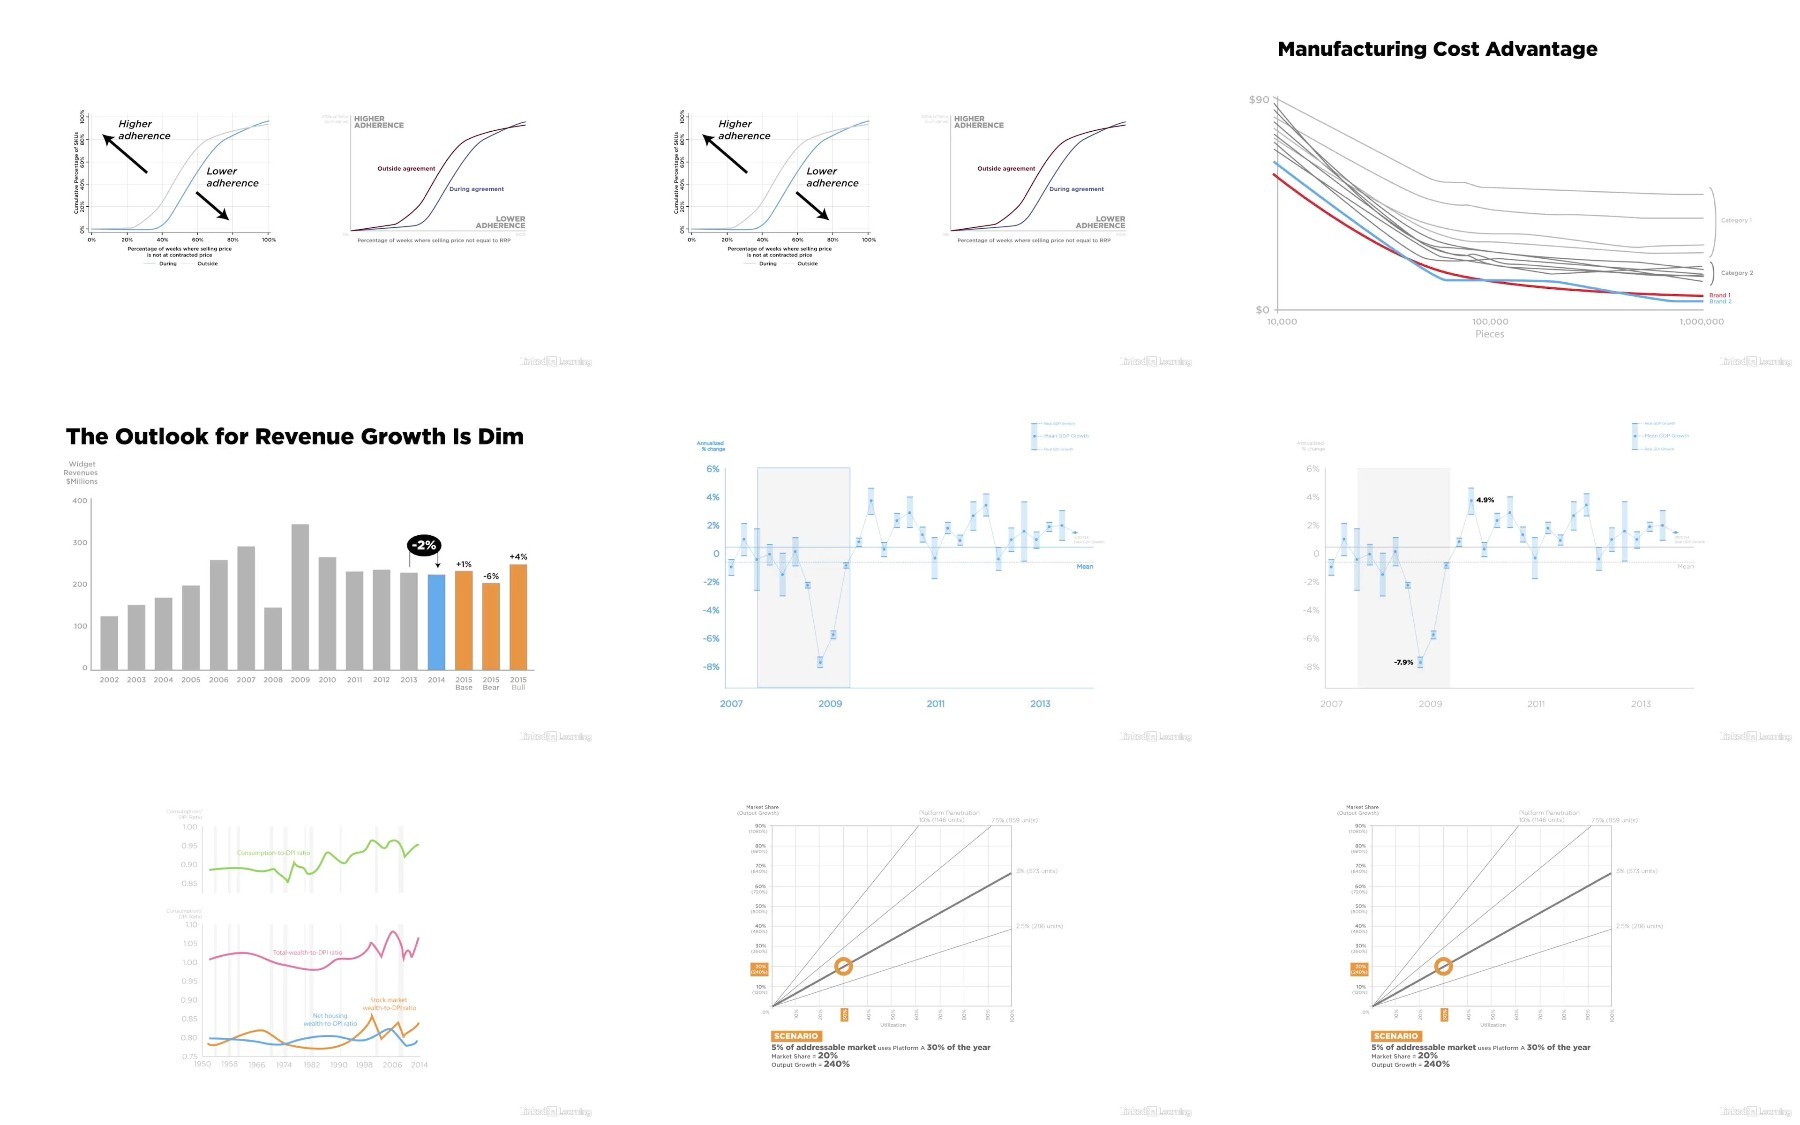
As a data analyst, you probably already know how to build visualizations and use tools like Excel and Tableau. This course challenges you to go beyond the data, beyond the software, and start thinking more clearly and strategically about the foundations of great communication design. Bill Shander, founder of Beehive Media, focuses on the key challenges that analysts face trying to communicate complex information, and how visual communication can help. Bill takes a deep dive into important strategies for visual analysis. He then breaks down ten key components of great data visualizations—built in any program—and shows innovative ways of rethinking the slides, charts, diagrams, and dashboards you work with every day.
More Info
More Info
We need your support!
Make a donation to help us stay online

Bitcoin (BTC)
bc1q08g9d22cxkawsjlf8etuek2pc9n2a3hs4cdrld

Bitcoin Cash (BCH)
qqvwexzhvgauxq2apgc4j0ewvcak6hh6lsnzmvtkem

Ethereum (ETH)
0xb55513D2c91A6e3c497621644ec99e206CDaf239

Litecoin (LTC)
ltc1qt6g2trfv9tjs4qj68sqc4uf0ukvc9jpnsyt59u

USDT (ERC20)
0xb55513D2c91A6e3c497621644ec99e206CDaf239

USDT (TRC20)
TYdPNrz7v1P9riWBWZ317oBgJueheGjATm
Information |
|||
 |
Users of GUESTS are not allowed to comment this publication. | ||