


Improve Your Charts And Data Visualizations In Powerpoint
Category: Tutorials
- views: 357
- date: 4 February 2023
- posted by: voska89
Published 2/2023
MP4 | Video: h264, 1280x720 | Audio: AAC, 44.1 KHz
Language: English | Size: 1.04 GB | Duration: 1h 52m
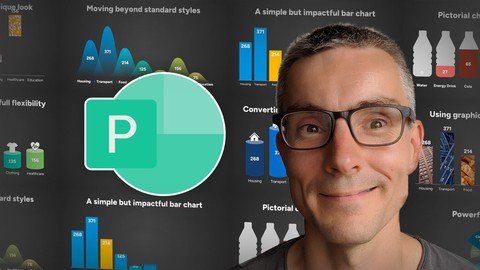
Make your presentation stand out with these chart and data visualization techniques.
What you'll learn
Create stunning charts to communicate your message effectively.
Use data visualization techniques to improve your PowerPoint charts.
Simplify your graphs so the audience doesn't have to work hard to understand your message.
Improve your PowerPoint workflow.
Understand the basic PowerPoint chart functionality.
Use call outs to re-enforce the message or add some supplementary information.
Make your charts less generic and help you stand out.
Create a unique variations that aren't available as PowerPoint options for charts.
Save any graph style as a template to use whenever you want.
Add any image into any bar chart, and avoid the image being stretched.
Convert to a non-live graph and have virtually limitless possibilities to customize the style and animation.
Produce a stunning stacked 3D pie chart that can be fully customized and animated.
Requirements
PowerPoint 2010 / 2013 / 2016 / 2019 (or Office 365)
Description
Data visualization is very important in presentations because it turns the raw data into something that is simple to understand. PowerPoint graphs and charts are an excellent way to show information visually, allowing an audience to understand and focus on what you are saying. There are lots of types of graph in PowerPoint, so it's important to choose the type of graph that suits your data and simplify your graphs so the audience doesn't have to work hard to understand your message.Hi, I'm Alan, a presentation designer who's been using PowerPoint for over 20 years. In this course I will to show you how you can quickly make easy changes to charts to improve how you present your data with impact. We will look at bar charts, pie charts, pictorial charts, key data point charts and proportional area charts and in each example, show you how some simple changes can make your data stand out.In most examples we will keep the data 'live' in PowerPoint so it can be easily modified at any point,but I will also show you how you can convert charts into shapes to give you full flexibility on how you want the chart to look and take your design to the next level.
Overview
Section 1: The Course
Lecture 1 Introduction
Lecture 2 A simple but impactful bar chart
Lecture 3 Moving beyond standard styles
Lecture 4 Using graphics for a unique look
Lecture 5 Pictorial charts in any shape
Lecture 6 Pictorial stacked charts
Lecture 7 Converting to shapes for full flexibility
Lecture 8 Powerful pie charts
Lecture 9 Enhancements and variations
Lecture 10 A custom stacked 3D pie chart
Lecture 11 Key data points
Lecture 12 Another distinctive look
Lecture 13 Creative use of the arc shape
Lecture 14 Proportional area chart
Lecture 15 Horizontal bar chart
Lecture 16 Something more creative
Lecture 17 Better line charts
Lecture 18 Area chart options
Lecture 19 Quick Access Toolbar
Lecture 20 Well done for completing the course
Any PowerPoint user who wishes to improve their PowerPoint charts.
Homepage
DOWNLOAD LINK
Fikper
siopr.Improve.Your.Charts.And.Data.Visualizations.In.Powerpoint.part1.rar.html
siopr.Improve.Your.Charts.And.Data.Visualizations.In.Powerpoint.part2.rar.html
Rapidgator
siopr.Improve.Your.Charts.And.Data.Visualizations.In.Powerpoint.part1.rar.html
siopr.Improve.Your.Charts.And.Data.Visualizations.In.Powerpoint.part2.rar.html
Uploadgig
siopr.Improve.Your.Charts.And.Data.Visualizations.In.Powerpoint.part1.rar
siopr.Improve.Your.Charts.And.Data.Visualizations.In.Powerpoint.part2.rar
NitroFlare
siopr.Improve.Your.Charts.And.Data.Visualizations.In.Powerpoint.part1.rar
siopr.Improve.Your.Charts.And.Data.Visualizations.In.Powerpoint.part2.rar
Links are Interchangeable - No Password - Single Extraction
We need your support!
Make a donation to help us stay online

Bitcoin (BTC)
bc1q08g9d22cxkawsjlf8etuek2pc9n2a3hs4cdrld

Bitcoin Cash (BCH)
qqvwexzhvgauxq2apgc4j0ewvcak6hh6lsnzmvtkem

Ethereum (ETH)
0xb55513D2c91A6e3c497621644ec99e206CDaf239

Litecoin (LTC)
ltc1qt6g2trfv9tjs4qj68sqc4uf0ukvc9jpnsyt59u

USDT (ERC20)
0xb55513D2c91A6e3c497621644ec99e206CDaf239

USDT (TRC20)
TYdPNrz7v1P9riWBWZ317oBgJueheGjATm
Information |
|||
 |
Users of GUESTS are not allowed to comment this publication. | ||