


Power BI/Data Analyst - Power BI/SQL/Azure/Excel/Alteryx
Category: Tutorials
- views: 590
- date: 29 March 2022
- posted by: voska89
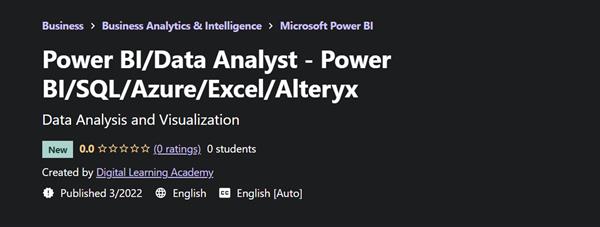
Power BI/Data Analyst - Power BI/SQL/Azure/Excel/Alteryx
MP4 | Video: h264, 1280x720 | Audio: AAC, 44.1 KHz, 2 Ch
Genre: eLearning | Language: English + srt | Duration: 43 lectures (4h 14m) | Size: 1.47 GB
Data Analysis and Visualization
What you'll learn
Connect to data sources
Clean, transform and load data
Create data visualizations
Create and publish reports to the Power BI Service
Transform less structured data
Perform data modelling
Perform time intelligence on models
Create and merge queries
Requirements
Basic knowledge of excel advised
Basic knowledge of SQL advised
Description
Power BI is a business analytics solution that lets you visualize your data and share insights across your organization, or embed them in your app or website. Connect to hundreds of data sources and bring your data to life with live dashboards and reports.
Discover how to quickly glean insights from your data using Power BI. This formidable set of business analytics tools-which includes the Power BI service, Power BI Desktop, and Power BI Mobile-can help you more effectively create and share impactful visualizations with others in your organization.
In this beginners course you will learn how to get started with this powerful toolset. We will cover topics like connecting to and transforming web based data sources. You will learn how to publish and share your reports and visuals on the Power BI service.
You will learn how to import data, create visualizations, and arrange those visualizations into reports. You will learn how to how to pin visualizations to dashboards for sharing. You will also learn how to use DAX language( Data Analysis Expressions) to perform calculations on data models.
Topics include
Connecting to SQL Server and PostgreSQL Databases
Connecting to Microsoft Access Database File
Creating reports with data visualizations
Modifying existing reports
Creating and managing data dashboards
Creating Power BI datasets, dashboards, reports, and workbooks
Connecting to web based data source
Connecting to Excel dataset
Using Query Editor
Joining tables and creating tables
Formulating via DAX logic
Using quick measures and dynamic measures
Using conditional statements
Performing various transformation on connected dataset
Who this course is for
Beginner Data Analyst
Beginner Data Scientist
Beginner Power BI Analyst
Homepage
https://www.udemy.com/course/power-bidata-analyst-power-bisqlazureexcelalteryx/DOWNLOAD LINK
https://hot4share.com/n2wcdaam85fz/ub8qg.P.B.A..P.B.rar.html
Download (Uploadgig)
https://uploadgig.com/file/download/f159a0f8F362cdB1/ub8qg.P.B.A..P.B.rar
Download ( Rapidgator )
https://rapidgator.net/file/4b87f1b91dddc3a9901d9925c45f1133/ub8qg.P.B.A..P.B.rar.html
Download ( NitroFlare )
https://nitro.download/view/20D92189016A43B/ub8qg.P.B.A..P.B.rar
Links are Interchangeable - No Password - Single Extraction
We need your support!
Make a donation to help us stay online

Bitcoin (BTC)
bc1q08g9d22cxkawsjlf8etuek2pc9n2a3hs4cdrld

Bitcoin Cash (BCH)
qqvwexzhvgauxq2apgc4j0ewvcak6hh6lsnzmvtkem

Ethereum (ETH)
0xb55513D2c91A6e3c497621644ec99e206CDaf239

Litecoin (LTC)
ltc1qt6g2trfv9tjs4qj68sqc4uf0ukvc9jpnsyt59u

USDT (ERC20)
0xb55513D2c91A6e3c497621644ec99e206CDaf239

USDT (TRC20)
TYdPNrz7v1P9riWBWZ317oBgJueheGjATm
Information |
|||
 |
Users of GUESTS are not allowed to comment this publication. | ||