


GvChart - jQuery plugin for Google Charts
Category: Plugins/Modules
- views: 6 385
- date: 23 October 2010
- posted by: kodakode
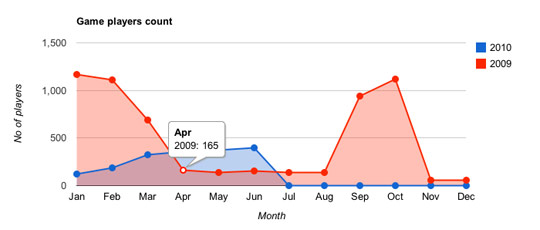
gvChart is a plugin for jQuery, that uses Google Charts to create interactive visualization by using data from the HTML table tag. It is easy in use and additionally it allows you to create five types of the charts.
Demo
http://adf.ly/9e2o
Download
http://adf.ly/9e2s
We need your support!
Make a donation to help us stay online

Bitcoin (BTC)
bc1q08g9d22cxkawsjlf8etuek2pc9n2a3hs4cdrld

Bitcoin Cash (BCH)
qqvwexzhvgauxq2apgc4j0ewvcak6hh6lsnzmvtkem

Ethereum (ETH)
0xb55513D2c91A6e3c497621644ec99e206CDaf239

Litecoin (LTC)
ltc1qt6g2trfv9tjs4qj68sqc4uf0ukvc9jpnsyt59u

USDT (ERC20)
0xb55513D2c91A6e3c497621644ec99e206CDaf239

USDT (TRC20)
TYdPNrz7v1P9riWBWZ317oBgJueheGjATm
Information |
|||
 |
Users of GUESTS are not allowed to comment this publication. | ||