


Cook D Interactively Exploring High-Dimensional Data and Models in R 2026
Category: eBooks
- views: 372
- date: 18 March 2026
- posted by: BeMyLove
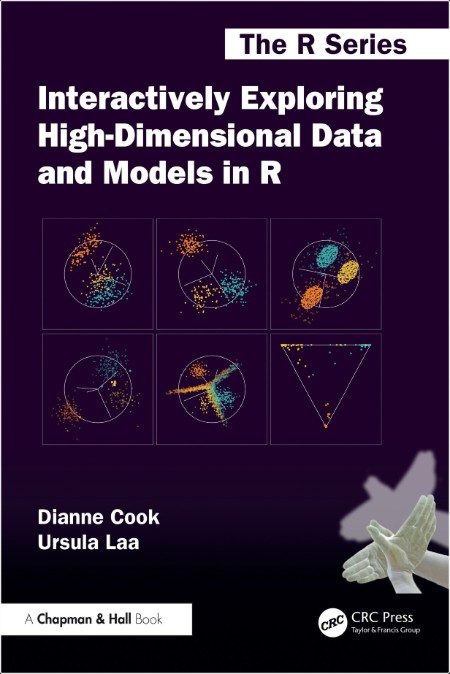
Cook D Interactively Exploring High-Dimensional Data and Models in R 2026 | 38.46 MB
Title: Interactively Exploring High-Dimensional Data and Models in R
Author: Dianne Cook;Ursula Laa;
Description:
Most data arrive with more than two numeric variables which means that plotting it on a computer screen or printed page presents a challenge: how do you visually explore for associations between more than two variables? Visualising data provides the opportunity to discover what we never expected, because it requires fewer assumptions to be made. Visualising elements of a model fit is a primary way to diagnose whether the fit matches this data. Two of more numeric variables is considered to be multivariate data, and when there are substantially more we would consider it to be high-dimensional data. This book provides you with the tools to visually explore high dimensions, to uncover associations, clustering and anomalies that may be missed when only using common methods for plotting one or two variables. It also illustrates how to use visualisation to understand how your model is operating on the data, to be able to explain how it is arriving at decisions. To make effective use of this material the reader should have a basic working knowledge of R and some understanding of multivariate statistical methods or machine learning methods. The book could form an independent course on visualization or be used as part of courses on multivariate statistical methods or machine learning.
High-dimensional data visualisation is valuable for understanding dimension reduction methods, unsupervised and supervised classification. This book is organised into these three topics, following overview and introductory chapters. The dimension reduction chapters cover principal component analysis and nonlinear dimension reduction. The chapters on cluster analysis cover hierarchical and k-means algorithms, model-based and self-organising maps, and finish with ways to communicate results and how to compare different results. The chapters on classification cover linear discriminant analysis, tree and forest algorithms, support vector machines and neural networks. We explain how to break down a neural network to examine the components, how to visualize predictive probabilities, and how to incorporate explainable AI metrics to develop a deeper understanding about how the model operates.

DOWNLOAD:
https://rapidgator.net/file/623ec64aba32647a8b14bc455f9c1042/Cook_D_Interactively_Exploring_High-Dimensional_Data_and_Models_in_R_2026.rar
https://nitroflare.com/view/63DBCF854B519EB/Cook_D_Interactively_Exploring_High-Dimensional_Data_and_Models_in_R_2026.rar
Most data arrive with more than two numeric variables which means that plotting it on a computer screen or printed page presents a challenge: how do you visually explore for associations between more than two variables? Visualising data provides the opportunity to discover what we never expected, because it requires fewer assumptions to be made. Visualising elements of a model fit is a primary way to diagnose whether the fit matches this data. Two of more numeric variables is considered to be multivariate data, and when there are substantially more we would consider it to be high-dimensional data. This book provides you with the tools to visually explore high dimensions, to uncover associations, clustering and anomalies that may be missed when only using common methods for plotting one or two variables. It also illustrates how to use visualisation to understand how your model is operating on the data, to be able to explain how it is arriving at decisions. To make effective use of this material the reader should have a basic working knowledge of R and some understanding of multivariate statistical methods or machine learning methods. The book could form an independent course on visualization or be used as part of courses on multivariate statistical methods or machine learning.
High-dimensional data visualisation is valuable for understanding dimension reduction methods, unsupervised and supervised classification. This book is organised into these three topics, following overview and introductory chapters. The dimension reduction chapters cover principal component analysis and nonlinear dimension reduction. The chapters on cluster analysis cover hierarchical and k-means algorithms, model-based and self-organising maps, and finish with ways to communicate results and how to compare different results. The chapters on classification cover linear discriminant analysis, tree and forest algorithms, support vector machines and neural networks. We explain how to break down a neural network to examine the components, how to visualize predictive probabilities, and how to incorporate explainable AI metrics to develop a deeper understanding about how the model operates.
DOWNLOAD:
https://rapidgator.net/file/623ec64aba32647a8b14bc455f9c1042/Cook_D_Interactively_Exploring_High-Dimensional_Data_and_Models_in_R_2026.rar
https://nitroflare.com/view/63DBCF854B519EB/Cook_D_Interactively_Exploring_High-Dimensional_Data_and_Models_in_R_2026.rar
We need your support!
Make a donation to help us stay online

Bitcoin (BTC)
bc1q08g9d22cxkawsjlf8etuek2pc9n2a3hs4cdrld

Bitcoin Cash (BCH)
qqvwexzhvgauxq2apgc4j0ewvcak6hh6lsnzmvtkem

Ethereum (ETH)
0xb55513D2c91A6e3c497621644ec99e206CDaf239

Litecoin (LTC)
ltc1qt6g2trfv9tjs4qj68sqc4uf0ukvc9jpnsyt59u

USDT (ERC20)
0xb55513D2c91A6e3c497621644ec99e206CDaf239

USDT (TRC20)
TYdPNrz7v1P9riWBWZ317oBgJueheGjATm
Information |
|||
 |
Users of GUESTS are not allowed to comment this publication. | ||