Data Visualization & Charts In Microsoft Powerpoint
Date: 2 May 2024 | Posted by: AD-TEAM

Data Visualization & Charts In Microsoft Powerpoint
Published 5/2024
MP4 | Video: h264, 1920x1080 | Audio: AAC, 44.1 KHz
Language: English
| Size: 1.37 GB[/center]
| Duration: 3h 1m
Learn everything about Charts in PowerPoint. Learn how to choose the right chart type for your Data Visualization.
What you'll learn
Most used chart types - Line, Bar, Column, Area and more
How to choose the right chart type
Effective use of PowerPoint's charting features
Animating charts & data
Understanding the principles of data visualization
Best practices for labeling and writing titles
Requirements
Powerpoint 2010/2013/2016/2019/2021 or Microsoft365 for MAC or Windows
No prior knowledge about Charts is required
Basic PowerPoint knowledge is useful, but not mandatory
Description
The course explained in one sentence:A practical approach to teaching all charting features of PowerPoint enhanced with practical data visualization tips and guidelines.Why charts in PowerPoint?Demystifying Charts - Let me teach you, once and for all, how to correctly approach and use charts in PowerPointPowerPoint Features - The reason so many charts look exactly alike is that not many people are diving deep into their options - but once you learn, just once, where everything is it repeats itself for most chart types.Correct data showcase - Know how to select your chart and what are the advantages of every chart. The line chart is optimal for time-based data that has many data points (above 10 for example), and the pie chart is perfect to showcase "parts of a whole", like percentages out of 100%.What will I learn?How to use charts in PowerPoint and all its featuresWhat chart type to use in what situationIt is completely project-based and practical PowerPoint usage at an intermediate levelDemistyfies the PowerPoint chart feature and makes you an expert in it.Who is this course for?Everyone who wants to learn about charts, once and for allData visualization is an ever-green, lifelong skill to acquire, so I would say it's for everyone. After this course, you will look differently at all the charts you see because I will give you practical advice about every chart type we work onThe course is suitable for PowerPoint for Windows and PowerPoint for MAC users, as all resources have been tested and confirmed to workResources:As always, I keep my courses practical and based on real-world experience. This is important especially with charts and data visualization in PowerPoint, since you need to be able to analyze your data set and select the correct chart for it. Each single chart type has several projects to follow along. Each project contains:- A dedicated data set as an example- A ready example of the chart so you can preview it- A custom slide with explanations to work step-by-stepHave PowerPoint charts changed over the years? No! This is an ever-green featurePowerPoint chart features are almost identical in all its versions. PowerPoint 2016, PowerPoint 2019, PowerPoint 2019 and now Microsoft365 with its subscription offer a variety of charts for our data visualizations. Let us learn all the features that we have available to make better Microsoft PowerPoint presentations. I hope you are interested in this amazing topic.Get ready to elevate your presentations with captivating charts and compelling data visualization techniques. Enroll now and I'll see you inside!
Overview
Section 1: Introduction
Lecture 1 Introduction
Lecture 2 Download Resources
Section 2: PowerPoint Charts - Understanding the Tool
Lecture 3 Introduction to different charts
Lecture 4 PowerPoint Charts #1 - Chart Basics (Part 1)
Lecture 5 PowerPoint Charts #1 - Chart Basics (Part 2)
Lecture 6 PowerPoint Charts #2 - Arcane Knowledge
Lecture 7 PowerPoint Charts #3 - Color Scheme
Lecture 8 PowerPoint Charts #4 – Design Elements of a Chart
Section 3: Data Visualization - Line Charts
Lecture 9 Line Chart - When to use
Lecture 10 Line Chart #1 (Part 1) - Chart and its title
Lecture 11 Line Chart #1 (Part 2) - Formatting and Labelling
Lecture 12 Line Chart #2 - Visual Declutter
Lecture 13 What is an Action Title
Lecture 14 Line Chart #3 - Highlighting Data
Section 4: Data Visualization - Column / Bar Charts
Lecture 15 Column and Bar Chart - Explanation
Lecture 16 Column and Bar #1 - Column Chart
Lecture 17 Column and Bar #2 - Bar Chart
Lecture 18 Stacked Column Chart - Explanation
Lecture 19 Column and Bar #3 - Stacked Bar Chart
Section 5: Data Visualization - Pie Charts
Lecture 20 Pie Chart – When to Use
Lecture 21 Pie Chart #1 - Formatting
Lecture 22 Pie Chart #2 – Rotating for correct display
Lecture 23 Pie Chart #3 – Doughnut Chart
Section 6: Data Visualization - Area Charts
Lecture 24 Area Chart – When to Use
Lecture 25 Area Chart #1 – Reorganize Series
Lecture 26 Area Chart #2 - Grouping Categories
Lecture 27 Area Chart #3 – Projective Data and PowerPoint for MAC
Lecture 28 Area Chart #4 – Stacked Area Chart
Section 7: Data Visualization - Waterfall Charts
Lecture 29 Waterfall Chart – Introduction
Lecture 30 Waterfall Chart #1 – With Two Totals
Lecture 31 Waterfall Chart #2 – With One Total
Section 8: Data Visualization - Pictographs
Lecture 32 Pictograph – Explanation
Lecture 33 Pictograph #1 – Icons as measurement
Lecture 34 Pictograph #2 – Icon Infographic
Section 9: Data Visualization - Maps
Lecture 35 Map Exercise #1 – World or Country
Lecture 36 Map Exercise #2 – Native PowerPoint Map
Lecture 37 Map Exercise #3 – PowerPoint Templates
Section 10: Data Visualization - Combo Chart
Lecture 38 Combo Chart #1 - Line and Column
Section 11: Animating Charts and Data
Lecture 39 Animation Practice #1 – Basics about Chart Animation
Lecture 40 Animation Practice #2 - Separating Series
Lecture 41 Animation Practice #3 – Animate by Series, by Category
Lecture 42 Animation Practice #4 – Using Transitions to Visualize Data
Lecture 43 Animation Practice #5 – Using PowerPoint Morph
Section 12: Good Practices & Useful PowerPoint Knowledge
Lecture 44 Good Practices #1 - Colors and Editing
Lecture 45 Good Practices #2 – Gradient Bars
Lecture 46 Good Practices #3 - Marker Design
Lecture 47 Good Practices #4 - Trendline
Lecture 48 Adding a Chart Template Windows and MAC
Lecture 49 Setting as Default - PowerPoint for Windows, PowerPoint for MAC
Section 13: Conclusion
Lecture 50 Thank You!
Lecture 51 Bonus Lecture
Anyone looking to enhance their presentation skills with well formatted charts,People for whom the PowerPoint charting tools are always difficult to use and understand,Anyone who wants to learn how to choose the right chart type,Designers wanting to expand their skill set to include data visualization in PowerPoint.,Professionals seeking to effectively communicate data-driven insights
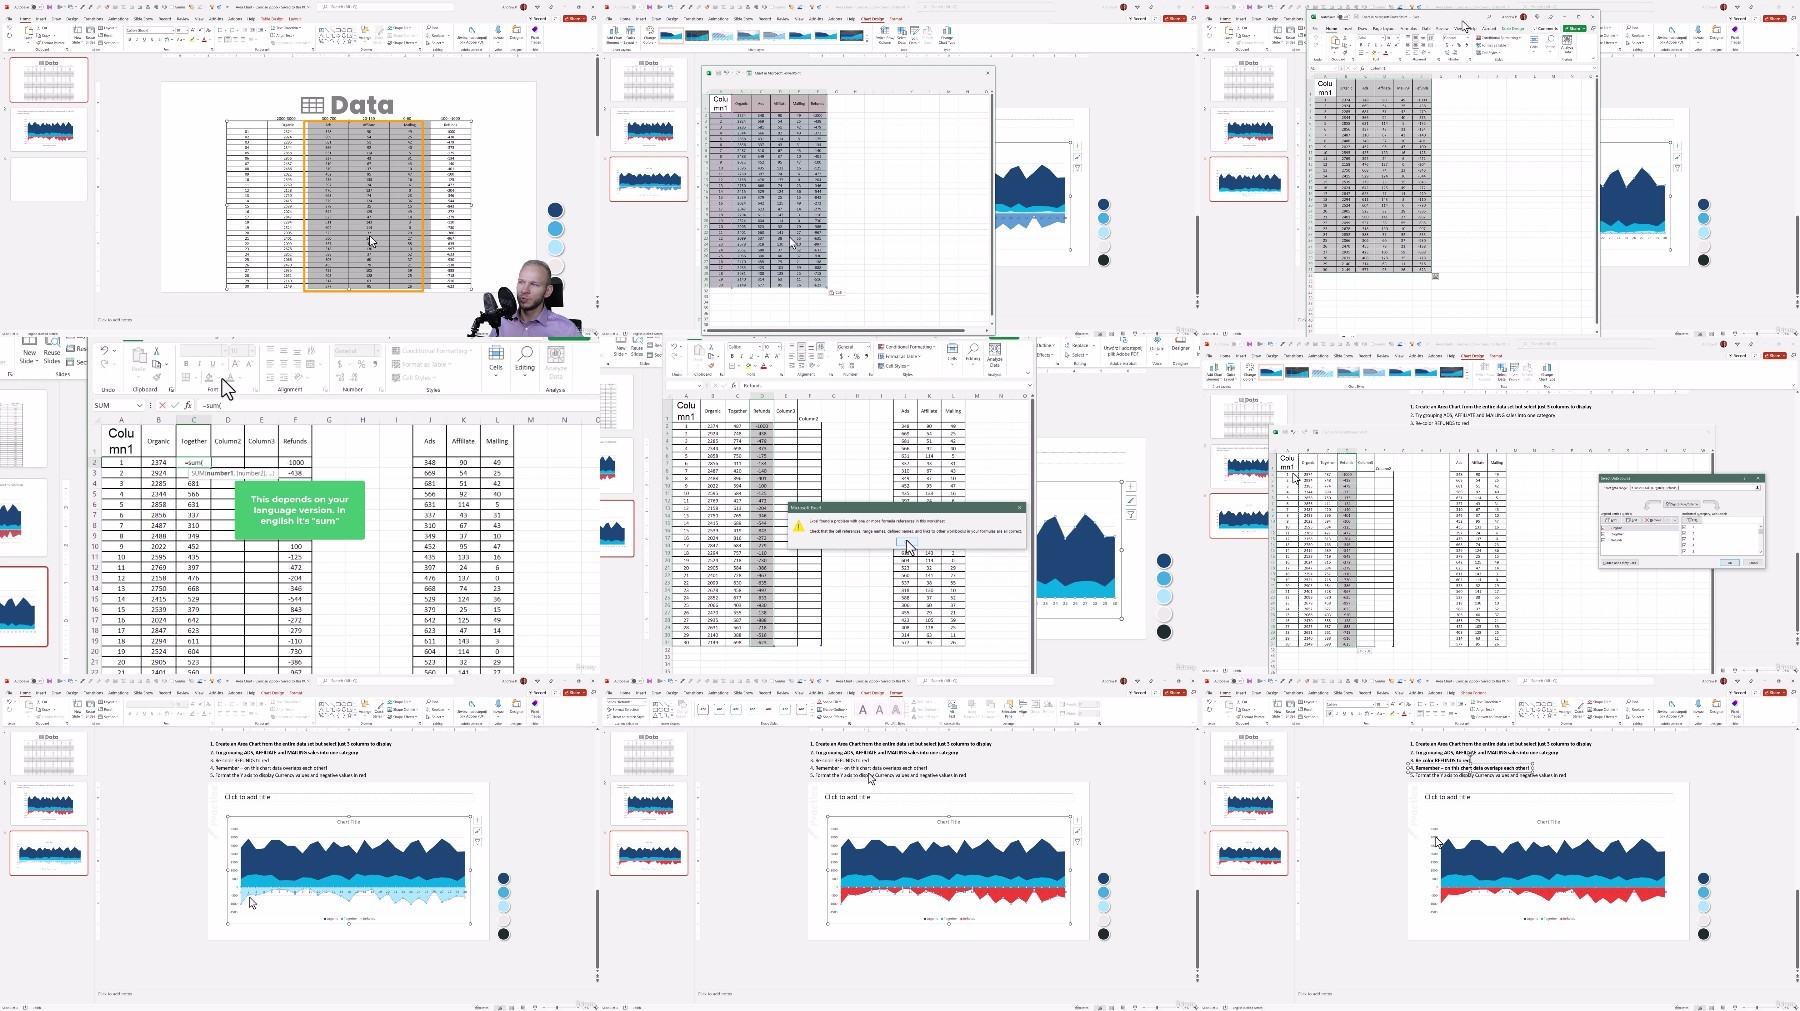
Free search engine download: Data Visualization Charts in Microsoft PowerPoint
See full article