Xrd Data Analysis And Interpretation
Date: 19 October 2023 | Posted by: mitsumi
Xrd Data Analysis And Interpretation
Published 10/2023
MP4 | Video: h264, 1280x720 | Audio: AAC, 44.1 KHz
Language: English | Size: 3.05 GB | Duration: 3h 39m
XRD Data Analysis in OriginLab and GSAS-II
Published 10/2023
MP4 | Video: h264, 1280x720 | Audio: AAC, 44.1 KHz
Language: English | Size: 3.05 GB | Duration: 3h 39m
XRD Data Analysis in OriginLab and GSAS-II
What you'll learn
Learn to install and use OriginLab and GSAS-II software for XRD data plotting and analysis efficiently.
Master baseline correction, smoothing, refinement, and deconvolution of peaks for accurate data interpretation.
Understand advanced techniques like, indexing, crystallite size calculation, lattice constants, microstrain analysis, and Williamson-Hall plot.
Acquire proficiency in GSAS-II software for XRD data plotting, refinement, and peak indexing for crystallographic studies.
Requirements
1. Basic understanding of XRD (X-ray Diffraction) principles.
2. Familiarity with fundamental data analysis concepts and software usage in scientific research.
3. Prior knowledge of crystallography and materials characterization techniques is beneficial.
4. Access to a computer with internet connectivity to download and install the required software tools (Origin, GSAS-II).
Description
This comprehensive course on Advanced XRD Data Analysis provides step-by-step guidance through a series of instructional video tutorials. Participants will learn how to effectively process, analyze, and visualize XRD and FTIR data using Origin and GSAS-II, two powerful software tools widely used in scientific research and industry.The course covers fundamental techniques such as baseline correction for XRD in Origin, smoothing XRD graphs, deconvoluting peaks, calculating Full Width at Half Maximum (FWHM), finding the area under curves, and plotting XRD data for publication. Participants will gain essential skills in determining crystallite size, lattice constants, microstrain, and dislocation density from XRD data using Origin. Additionally, the course explores advanced topics like adding negative hkl indices to XRD graphs, subtracting instrumental broadening, and utilizing Williamson-Hall plots for crystallite size and microstrain analysis.Participants will also receive instructions on installing and utilizing GSAS-II, a free XRD data analysis software. The course covers simple plotting and refinement of XRD data in GSAS-II, finding and indexing XRD peaks, and utilizing GSAS for efficient XRD data analysis.By the end of this course, participants will have a strong understanding of advanced XRD data analysis techniques, enabling them to conduct in-depth analyses and generate insightful visualizations for their research and applications.
Overview
Section 1: Introduction and Software Setup
Lecture 1 How to Download and Install OriginLab Software for Free
Section 2: XRD Data Analysis Basics
Lecture 2 How to plot XRD data - From machine data to a publishable graph
Lecture 3 How to calculate Full Width at Half Maximum (FWHM) of a curve
Lecture 4 How to smooth XRD graph
Lecture 5 How to subtract instrumental broadening (Kα1 and Kα2 overlap) from XRD data
Lecture 6 How to subtract instrumental broadening (βi) from XRD data
Lecture 7 Baseline correction to XRD data
Section 3: Peak Analysis and Data Interpretation
Lecture 8 How to quickly find XRD peak positions and label them in a graph
Lecture 9 How to deconvolute a peak / multiple peaks fitting
Lecture 10 How to calculate area under the curve
Lecture 11 How to find FWHM and area under the curve with one click
Lecture 12 How to add negative hkl indices to XRD graph
Lecture 13 How to quickly find peaks positions and label them in a graph
Lecture 14 How to find peaks in XRD plot with one click
Section 4: Advanced XRD Analysis
Lecture 15 How to calculate the crystallite size from XRD data
Lecture 16 How to calculate d-spacing (interplanar spacing) from XRD data
Lecture 17 How to calculate lattice constants from XRD data
Lecture 18 How to calculate lattice type and parameters directly from XRD data
Lecture 19 How to calculate crystallinity index from XRD data
Lecture 20 How to calculate dislocation density from XRD data
Lecture 21 How to calculate microstrain from XRD data
Lecture 22 Williamson-Hall Plot | W-H Plot | Crystallite Size | Microstrain
Lecture 23 FWHM vs Integral Breadth | Crystallite Size | Microstrain
Lecture 24 W-H Plots | UDM-USDM-UDEDM | Crystallite Size | Microstrain | Energy Density
Section 5: GSAS-II Software Tutorial
Lecture 25 How to install GSAS-II - A Free XRD Data Analysis Software
Lecture 26 XRD data analysis: simple plotting and refinement in GSAS-II
Lecture 27 How to quickly find and index XRD peaks in GSAS
1. Students and Researchers in Materials Science and Chemistry,2. Professionals in Analytical Laboratories,3. Academic Professionals and Educators,4. Anyone Interested in Advanced Data Analysis
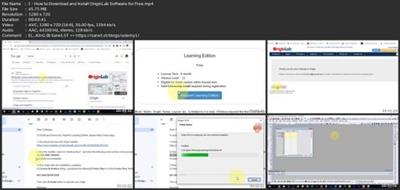
Screenshots
Download link
rapidgator.net:
https://rapidgator.net/file/9d3fad65d8f580488383174cbad826e7/qnhut.Xrd.Data.Analysis.And.Interpretation.part1.rar.html
https://rapidgator.net/file/0e12f9c343ceab8d3d870f394cd9895d/qnhut.Xrd.Data.Analysis.And.Interpretation.part2.rar.html
https://rapidgator.net/file/20d81731dc41e2205a137cda367764cf/qnhut.Xrd.Data.Analysis.And.Interpretation.part3.rar.html
https://rapidgator.net/file/4362c44fbd609efa0d45e284fabdcf56/qnhut.Xrd.Data.Analysis.And.Interpretation.part4.rar.html
uploadgig.com:
https://uploadgig.com/file/download/c104d6e223d013a1/qnhut.Xrd.Data.Analysis.And.Interpretation.part1.rar
https://uploadgig.com/file/download/08487c92d152e8df/qnhut.Xrd.Data.Analysis.And.Interpretation.part2.rar
https://uploadgig.com/file/download/3d7f8dd4542BE977/qnhut.Xrd.Data.Analysis.And.Interpretation.part3.rar
https://uploadgig.com/file/download/923a6978a2A21988/qnhut.Xrd.Data.Analysis.And.Interpretation.part4.rar
nitroflare.com:
https://nitroflare.com/view/D51ACEA456AD688/qnhut.Xrd.Data.Analysis.And.Interpretation.part1.rar
https://nitroflare.com/view/A4FBDCAC44790D6/qnhut.Xrd.Data.Analysis.And.Interpretation.part2.rar
https://nitroflare.com/view/09EF5341175A9B8/qnhut.Xrd.Data.Analysis.And.Interpretation.part3.rar
https://nitroflare.com/view/5284D6C1EF87BEF/qnhut.Xrd.Data.Analysis.And.Interpretation.part4.rar
See full article