Create Bi Reports With Power Bi Using Excel Data
Date: 17 June 2022 | Posted by: voska89
Last updated 5/2022
MP4 | Video: h264, 1280x720 | Audio: AAC, 44.1 KHz
Language: English | Size: 380.08 MB | Duration: 1h 10m
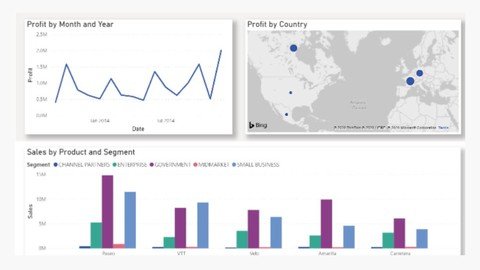
Build stunning visual reports in Power BI
What you'll learn
Connecting to Excel workbook data
Clean & Transform data
Write DAX expressions to create measures
Write DAX Expressions to create tables
Join tables using DAX Expressions
Building Your Report
Format Report
Publish report to Power BI Service
Requirements
Power BI Desktop is required. ( The course covers how to install it)
Account on Microsoft 365 required. ( The course shows you how to get a free account)
Description
Microsoft Power BI is a suite of business intelligence (BI), reporting, and data visualization products and services for individuals and teams. Power BI stands out with streamlined publication and distribution capabilities, as well as integration with other Microsoft products and services. Power BI is a business analytics solution that lets you visualize your data and share insights across your organization, or embed them in your app or website." The solution comprises several products and services, and value and versatility comes from leveraging the individual elements, and taking advantage of how they work together.Power BI service is a secure Microsoft hosted cloud service that lets users view dashboards, reports, and Power BI apps — a type of content that combines related dashboards and reports — using a web browser or via mobile apps for Windows, iOS, and Android.Power BI Desktop is a free, self-service data analysis and report authoring tool that you install on a Windows computer. It can connect to more than 70 on-premises and cloud data sources to turn information into interactive visuals. Data scientists and developers work with Power BI Desktop to produce reports and make them available to the Power BI service.In Power BI Desktop, users can:Connect to dataTransform and model the dataCreate reports and dashboards that are collections of visualsShare reports with others using the Power BI serviceFormat reportIn this course you learn how to create stunning visuals in your Power BI reports using Microsoft Excel Workbook data.
Overview
Section 1: Power BI Setup
Lecture 1 Introduction
Lecture 2 What is Power BI
Lecture 3 What is Power BI Desktop
Lecture 4 Install Power BI Desktop
Lecture 5 Explore Power BI Desktop Interface
Lecture 6 Install Microsoft 365
Lecture 7 Explore Microsoft 365
Lecture 8 Add new users to office 365
Section 2: Create a report with Power BI using Excel data
Lecture 9 The Task
Lecture 10 Data Source
Lecture 11 Connecting to Excel data
Lecture 12 Clean & Transform data
Lecture 13 What are DAX & Measures
Lecture 14 Join tables using DAX Expressions
Lecture 15 Building Your Report
Lecture 16 Format Your Report
Lecture 17 Publish report to Power BI Service
Beginner Data Analyst,Beginner Data Scientist,Beginner Power BI Analyst
Homepage
https://www.udemy.com/course/create-bi-reports-with-power-bi-using-excel-data/DOWNLOAD LINK
Download ( Rapidgator )
https://rapidgator.net/file/54e83cbecf89f99f6d7e1782aef0d79c/uzmrq.Create.Bi.Reports.With.Power.Bi.Using.Excel.Data.rar.html
Download ( NitroFlare )
https://nitro.download/view/EEDABED9A81E0DA/uzmrq.Create.Bi.Reports.With.Power.Bi.Using.Excel.Data.rar
Download (Uploadgig)
https://uploadgig.com/file/download/5f1D3a3acD347a26/uzmrq.Create.Bi.Reports.With.Power.Bi.Using.Excel.Data.rar
Links are Interchangeable - No Password - Single Extraction
See full article